In idef0 notation, tunnels are used for notation. Principles of constructing the idef0 model
The abbreviation IDEF0, known today not only in narrow circles, is the first methodology that standardizes work on business processes. It was developed in the middle of the last century as part of an aerospace project in the USA and, having shown its effectiveness, became a federal standard. In our country, in 2000, a document was prepared “ Functional modeling methodology IDEF0. Guidance document Functional Modeling Methodology IDEF0 Guidance Document. Official publication. State Standard of Russia RD IDEF0 – 2000. Developed by the Research Center CALS – Applied Logistics Technologies. Adopted and put into effect by the Decree of the State Standard of Russia in 2000, Moscow", but it was never approved as a standard. Although this did not prevent this methodology from becoming one of the most popular tools for graphical modeling of business processes in our country. In this article, I invite you to consider the IDEF0 model and evaluate the relevance of this approach at the present time.
Basic concepts and abbreviations
Let's look a little at the names of the key elements of the methodology. The IDEF0 graphic standard is part of the SADT (Structured Analysis and Design Technique) methodology. IDEF is an abbreviation for ICAM Definition, and ICAM is derived from Integrated Computer Aided Manufacturing, which translates as integrated computerization of production. The SADT methodology is a whole family of 15 different models, which together should have made it possible to study the structure, parameters and characteristics of production, technical and organizational-economic systems.
IDEF0 is a functional model, which is the core of the construction of all other structures; it links together information and material flows, organizational structure, control influences and the very activities of the company. The graphical standard for modeling processes is also called notation. That is, notation is a system of requirements and rules for constructing an activity model in one form or another. Therefore, IDEF0 is appropriately called a notation that is part of the SADT methodology.
The IDEF0 notation is a fairly strict methodology that was originally developed, like technical design standards, for manual modeling. Therefore, it contains requirements for the placement of arrows, the format of all elements, the content of the information frame for the IDEF0 diagram, etc. Since the company’s activities are a complex multi-level system of actions, there are always many diagrams, and unambiguous systematization and navigation through all elements of the model is necessary. Nowadays this is done mainly by computer systems that support modeling in this notation. In Russia, the most famous and accessible systems today are AllFusion Process Modeler and Business Studio. I plan to devote separate articles to a review of these systems.
Function block
The central element of the IDEF0 model is the function, which is shown in the diagram as function block– a rectangle inside which an action is indicated in the form of a verbal noun. The action can be very different in scale - from the activities of the company in general and to specific manipulation in particular. Examples: “Production and sale of ceramic tableware” and “Applying a design to a product.”

Required Function Block Elements in IDEF0
Regardless of the scale of actions, all functions are displayed uniformly and necessarily contain 4 key flows, which are rigidly assigned to the sides of the function block:
- on the left are the inputs or resources used to perform the function;
- on the right are the outputs or results of executing the function;
- on top are control actions that determine how and how many results need to be produced;
- below are the mechanisms that reflect who should do this work and with what help.
This approach allows you to save a little on explanations in the diagrams and achieve unambiguity in the display of flows, which makes the entire model harmonious.
To build a functional model, the IDEF0 methodology requires the following rules to be observed.
- Inputs are resources that transfer their value to outputs completely, that is, they are completely spent on creating the result, and mechanisms are resources that transfer their value only partially (equipment through depreciation, and people through wages).
- Management is a necessary element of the model, since it ties all actions to the company’s system of regulations, clearly indicating what rules and requirements must be observed in the process of performing the function. Often this flow is treated formally, but in this case the scheme loses rigor and sometimes even meaning.
- Each function block must have at least one arrow on each side (since there can be no work without resources or results, and instructions are incomplete without a performer or instructions).
The considered scheme is the “building block” of the IDEF0 approach. Functional modeling involves a gradual transition from the general to the specific through decomposition. Decomposition is “deepening” into the function under consideration, dividing it into smaller functions. Moreover, when a top-level function is presented in a generalized manner and then decomposed, it is appropriate to call it a process.
Context diagram
At the highest level, the company is represented as a “black box” in which certain activities occur that translate inputs into outputs. This level is usually called “,” that is, a diagram that describes the context of the company’s activities. Additionally, the context diagram displays key characteristics of the entire model.
- The goal is a specific formulation of the purpose of the model, against which the accuracy of the model can be verified in the future.
- Point of view - on whose behalf the model is built, since the model is always dependent on its author and focus of attention. If we build a general model of an enterprise, then it is usually presented from the point of view of its director.
- Model type is an indication of what information is displayed on the diagrams. There can be 2 fundamental options: AS IS (“as is”) or TO BE (“as will be”). This division is necessary, since we can build models both for analyzing activities and for transforming them. We must be clear about what we are doing, and also convey this information to others.
Thus, the context diagram contains in the most general form a description of the company’s activities, which are permeated by flows connecting the company with the outside world. I think we should also look at them in a little more detail.
Main threads
Experience has shown that, despite the apparent simplicity and formality of this level, one often has to linger on it for a long time, since all results that are significant for the owner and the market must be reflected here. An error can lead to the creation of models that do not fulfill the business objectives. To check that meaningful flows are reflected, make sure that all 4 main types of flows are present in your diagram.
- Material: materials and components at the input and finished products at the output.
- Client: potential client at the entrance and satisfied at the exit.
- Financial: the input is usually investments, customer payments (revenue), loans and other income; The output is payments to suppliers, taxes, loan payments and profits.
- Informational: the input is all flows of information about the external environment (market conditions, behavior of competitors, technological innovations, etc.), and the output is the flow of information that the company communicates about itself to the world (all advertising information, as well as all types of reporting before regulatory authorities).
Please note that the company is an open system, and nothing appears or disappears in it. The company is only able to transform incoming flows into outgoing ones, and if it does this well, then additional cash flow (profit) appears, which in some sense reflects the quality of the entire system.

(click to enlarge)
It's a good idea to highlight each of these types of flows with a different color so that you can easily distinguish the movement of resources and not miss important points. For example, you can often observe the absence of a client in the company’s flows, so work with him is based on the residual principle - the client often feels like a hindrance to company employees whose tasks are focused on processing the flow of documents.
Control arrows can be represented by only 1 type of flow - information, which can be divided into 2 subtypes. The first is documents such as:
- laws and regulations;
- orders, instructions;
- instructions and regulations;
- plans;
- design documentation, etc.
The second is undocumented information, which most often refers to the requirements of the owners.
And finally, mechanisms - there are only 2 types of flows: equipment (material) and performers (divisions and people). There can be no documents here, just as there can be no people on the control switches!
For navigation, the model provides continuous numbering. The context diagram is numbered "A-0". Subsequently, each functional block receives its own number, no matter how deep the decomposition is.
Decomposition
After working through the flows of the context diagram, we can move on to decomposition. Moving to a lower level, as if opening a “black box”, we first see a blank sheet with arrows that have been attached to the functional block.

(click to enlarge)
And this is where functional modeling itself begins - we must understand what set of actions can connect these flows and ensure that all requirements are met. The difficulty is that there are a lot of actions in the company, and on the diagram we have the right to display no more than 9 functions, otherwise the diagram will become unreadable and therefore useless.
It is not always easy to arrange complex activities so that they remain visual, readable, and at the same time complete. Most often, they resort to dividing the entire variety of processes into major large blocks, the most significant of which are the following.
- Creation of a product (result).
- Promotion and sales – working with client flow.
- Ensuring activities to create a product are secondary processes that are necessary to comply with government requirements or ease of work (personnel and accounting, transport services, cleaning, etc.).
- Creating control flows is the activity of developing management decisions that will determine the requirements for all company processes.
The figure below shows the decomposition diagram of our example.

(click to enlarge)
On the diagram, processes should be located diagonally - this is called the principle of dominance, which implies the arrangement of functional blocks from left to right and from top to bottom - in order of importance or in chronological order. The numbering of blocks occurs in the same way.
Further work on the model is similar to the first step - decomposition of each functional block of the first level is carried out. The block numbering will contain the number of the first level: A1.1 ... A1.n, A2.1 ... A2.n, etc.
Conclusions about the relevance of the notation
Within the framework of this article, we were able to display only the basic concepts of the IDEF0 notation using a short example of IDEF0, from which, of course, it is difficult to judge the methodology as a whole. But quite a lot of experience using this notation in practice allows me to draw the following conclusions.
- The model has good visualization potential, but, in my opinion, its greater importance lies in its disciplinary effect. The rules and restrictions embedded in the methodology force us to develop a systematic and strict attitude towards models, which has a very good effect on the quality of the final result.
- The model allows you to build communication flows between seemingly not very connected things: to connect the front and back office subsystems with management, which is much worse achieved by other notations.
- The approach is simple and understandable for most project participants. Building and reading diagrams in this notation is limited only by the desire to delve into the intricacy of business flows.
Some of the above arguments make us think that this approach is the best and only one for complete activity modeling. But we must not forget that the functional model is designed only for the upper level of modeling. Using the IDEF0 notation to design work at the executor level leads to the fact that the diagrams are purely illustrative and it is impossible to build meaningful regulations on their basis, since they do not contain:
- specifying the events of starting and stopping the process;
- conditions for transition from one action to another;
- the ability to visually display all resources and performers without overloading the diagram with arrows.
Therefore, if you use this notation for the tasks for which it is intended (structuring top-level activities), then IDEF0 is practically the only notation today that allows you to do this meaningfully and accurately.
In project management, this modeling standard is most applicable where it is necessary to connect different projects or processes with visual flows. The graphical model will allow for a more rational distribution of responsibility and resources among tasks. The logic for completing project tasks, reflected in the diagrams, will help prepare a better schedule in the form of a Gantt chart.
The main one of the three methodologies supported by BPwin is IDEF0. IDEF0, belongs to the IDEF family, which appeared in the late sixties under the name SADT (Structured Analysis and Design Technique). IDEF0 can be used to model a wide range of systems. For new systems, the use of IDEF0 is aimed at defining requirements and specifying functions for the subsequent development of a system that meets the requirements and implements the selected functions. When applied to existing systems, IDEF0 can be used to analyze the functions performed by the system and map the mechanisms by which those functions are performed. The result of applying IDEF0 to a system is a model of that system consisting of a hierarchically ordered set of diagrams, documentation text, and vocabularies that are cross-referenced together. The two most important components that make up IDEF0 diagrams are the business functions or activities (represented in the diagrams as boxes) and the data and objects (represented as arrows) that connect the activities. In this case, the arrows, depending on which face of the work rectangle they enter or which face they exit from, are divided into five types:
· Entry arrows (included in the left side of the work) - depict data or objects that change during the execution of the work.
· Control arrows (included in the upper edge of the work) - depict the rules and restrictions according to which the work is performed.
· Exit arrows (coming out from the right side of the work) - depict data or objects that appear as a result of the work.
· Mechanism arrows (included in the bottom edge of the work) - depict the resources necessary to complete the work, but do not change during the work (for example, equipment, human resources...)
· Call arrows (coming from the bottom edge of the work) - depict connections between different diagrams or models, pointing to a certain diagram where this work is discussed in more detail.
All jobs and arrows must be named. The first diagram in the IDEF0 diagram hierarchy always depicts the functioning of the system as a whole. Such diagrams are called context diagrams. The context includes a description of the purpose of the modeling, the scope (a description of what will be considered as a component of the system and what as an external influence) and the point of view (the position from which the model will be built). Typically, the point of view is the point of view of the person or object responsible for the operation of the modeled system as a whole.
Figure 7.1. Functional block and interface arcs
Activities on diagrams are depicted as rectangles (functional blocks). Each job depicts some function or task and is named by a verb or verb phrase indicating the action, for example, “Making a product,” “Customer service,” etc. Arrows are marked with a noun and indicate objects or information that connects the works with each other and with the outside world.
After describing the context, a functional decomposition is carried out - the system is divided into subsystems and each subsystem is described in the same syntax as the system as a whole. Then each subsystem is divided into smaller ones, and so on until the desired level of detail is achieved. As a result of this partition, each fragment of the system is depicted on a separate decomposition diagram.
Once the context has been described, the following diagrams in the hierarchy are constructed. Each subsequent diagram is a more detailed description (decomposition) of one of the works in the above diagram. An example of contextual work decomposition is shown in Figure 7.2 and Figure 7.4. The description of each subsystem is carried out by an analyst together with a subject area expert. Typically the expert is the person in charge of that subsystem and therefore has a thorough knowledge of all its functions. Thus, the entire system is divided into subsystems to the required level of detail, and a model is obtained that approximates the system with a given level of accuracy. Having received a model that adequately reflects current business processes (the so-called AS IS model), the analyst can easily see all the most vulnerable points of the system. After this, taking into account the identified shortcomings, it is possible to build a model of a new organization of business processes (TO BE model).
One of the most important features of the SADT methodology is the gradual introduction of greater and greater levels of detail as diagrams representing the model are created.
Figure 7.2, which shows three diagrams and their relationships, shows the structure of the IDEF0.-model. Each component of the model can be decomposed into a different diagram. Each diagram illustrates the "internal structure" of a block in its parent diagram.
 Figure 7.2 - Example of a context diagram
As can be seen in Fig. 7.2, BPwin allows you to highlight activities and arrows in different colors, as well as link the names of the arrows to the arrows themselves (an arrow named “Reporting”), which increases the clarity and readability of the diagram.

Figure 7.3 - Example of a decomposition diagram

Figure 7.4 - Example of a context diagram

Figure 7.5 - Decomposition diagram example
Diagram Hierarchy
The construction of the IDEF0 model begins with the representation of the entire system in the form of the simplest component - one block and arcs depicting interfaces with functions outside the system. Because a single block represents the entire system as a whole, the name specified in the block is generic. This is also true for interface arcs - they also represent the complete set of external interfaces of the system as a whole.
The block that represents the system as a single module is then detailed in another diagram using several blocks connected by interface arcs. These blocks represent the main subfunctions of the original function. This decomposition reveals a complete set of subfunctions, each of which is represented as a block, the boundaries of which are defined by interface arcs. Each of these subfunctions can be decomposed in a similar way to provide a more detailed representation.
In all cases, each subfunction can contain only those elements that are included in the original function. In addition, the model cannot omit any elements, i.e., as already noted, the parent block and its interfaces provide context. Nothing can be added to it, and nothing can be removed from it.
The arcs going in and out of a block in a top-level diagram are exactly the same as the arcs going in and out of a lower-level diagram, because the block and the diagram represent the same part of the system.

Figure 7.6 - Structure of the SADT model. Decomposition of diagrams


Figure 7.7 - Compliance must be complete and consistent
Some arcs are connected to the diagram blocks at both ends, while others have one end unattached. Unconnected arcs correspond to inputs, controls and outputs of the parent block. The source or destination of these boundary arcs can only be found in the parent diagram. The unattached ends must match the arcs on the original diagram. All boundary arcs must continue on the parent diagram for it to be complete and consistent.
As noted, the mechanisms (arcs on the bottom side) show the means by which functions are performed. The mechanism can be a person, a computer, or any other device that helps perform a given function (Figure 7.8).

Rice. 7.8. Mechanism example
Each block on the diagram has its own number. A block of any diagram can be further described by a lower-level diagram, which in turn can be further detailed with the required number of diagrams. Thus, a hierarchy of diagrams is formed.
Chart numbers are used to indicate the position of any chart or block in the hierarchy. For example, A21 is a diagram that details block 1 in diagram A2. Similarly, A2 details block 2 in diagram A0, which is the topmost diagram of the model. Figure 7.9 shows a typical diagram tree.

Figure 7.9 - Hierarchy of diagrams
September 16, 2010 1:08 pm"Divide et impera"
Maxim of the Roman Senate
It was 1981, the US Air Force was developing an industrial automation program, which was called ICAM (Integrated Computer Aided Manufacturing). For the successful progress of the project, it was necessary for all participants to be able to simulate an automated enterprise in parallel. A set of standards has been developed specifically for these purposes IDEF (ICAM DEFinition). One of the set standards was a functional modeling notation codenamed IDEF0, which has been slightly modified over time, and the specification for the latest version was released in December 1993.
I’ll tell you a little about the features of the process of functional modeling of a business process using notation IDEF0 and at the same time I will help Aristarkh Grigorievich, whom I mentioned in the previous article: I will describe the business process of preparing borscht.
Functional modeling begins by identifying the main task that is solved by executing this business process. In our case, this task is formulated as follows: “Prepare borscht.” It seems to me that it is more effective to start the modeling process by determining what data and materials we have before executing the business process (Input), as well as clearly understanding what we want to get as a result of executing the business process (Output / Output). This will make it possible to identify clear requirements for the business process and discard unrealistic hopes: having only a handful of stones of dubious origin, it is impossible to obtain gold bars. In the case of preparing borscht, there are, for example, vegetables and meat at the entrance (they may, of course, not be there, but let’s assume that all the products were prudently purchased). At the exit we should quite logically get borscht.
The IDEF0 notation also assumes that in order to carry out functional modeling, it is necessary to identify the so-called mechanism (mechanism), i.e. those performers who will be involved in the business process. In our example, the mechanism is Aristarkh Grigorievich himself and, say, his eldest son Kolya. The correct execution of the process must be controlled by something (some standards, methods, technologies, etc.). This something in IDEF0 notation is called “control” and must appear on the functional diagram.
Once the business analyst has identified the inputs and outputs and established the mechanism and controls, all this information can be summarized into a first diagram called a context diagram. It will look like in Figure 1.
Rice. 1. Context diagram
The main goal of a context diagram is to identify the main task, the one and only function that the execution of a business process solves. A context diagram is especially important when putting together a general view of the business problem being solved: what do we need and in what quantity, what will we get as a result, who is involved in the business process, what regulatory documents do we need to properly solve the problem.
A context diagram does not give a complete view of the process, but only a general view. In order to view the sequence of the process, you need to turn the microscope wheel: decompose the diagram, i.e. give a slightly more detailed description of the process. It has always been more convenient for me to break a gigantic general task into 4-5 smaller ones, with approximately the same level of detail. These tasks can be either sequential or parallel in their execution time. For example, in the case of preparing borscht, these tasks come down to: preparing the broth, preparing vegetables, actually cooking and serving the dish. It is clear that you can cook the broth and prepare the vegetables at the same time, but serving the borscht before it has been seasoned will turn out badly. Let's get a diagram, for example, like the one shown in Figure 2.

Rice. 2. First level decomposition diagram
In the same way, you can decompose each of these small functions until the required level of detail is achieved.
I see a very big advantage of decomposition in the fact that when describing some heavy, for example, technological process, you can indicate an entire workshop, for example, a molding shop, as the main executor of the process in the context diagram, and then select individual teams, for example, on the decomposition diagram this workshop, responsible for one direction or another in the execution of the process. It is especially important that for each decomposition block, like the entire context diagram as a whole, both input data and output data are indicated. Those. we can control the flow of resources, distributing them, reducing them in some places, increasing them in others, we can understand that it is necessary to postpone some of the work, since, for example, it is not possible to use the same machine at the same time. In the lower left corner of the decomposition blocks, the approximate cost of performing an operation is indicated, which allows you to highlight more costly operations that need to be worked out in more detail. And vice versa: small tasks are easier to evaluate than large ones. Having found the cost of completing each of the small tasks, the cost of the large task can be calculated by simply adding up the costs of the small tasks.
The big drawback of the IDEF0 notation is, in my opinion, that it does not reflect well, and in general not at all, the reaction of process participants to environmental events. Therefore, it is impossible to assess the risks associated with changes in the external environment, and it is also impossible to model rollback options. That is why, in my opinion, the IDEF0 notation is perfectly suitable for describing not business processes, but technological processes in which the influence of the environment is excluded, since operations are carried out according to plan. Of course, equipment breakdowns cannot be ruled out. But, if you think about it, equipment failure only leads to the need to repair or change the equipment. In most cases, this results in either a delay or cancellation of the process at some stage, but not a rollback (imagine how, when a kiln breaks down, bricks again disintegrate into sand and clay), whereas when exceptional situations arise in a business environment, In most cases, rollback actions are required. That is why the IDEF0 notation seems more acceptable for describing technological processes.
In the next episodes you will find exciting stories about BPMN, EPC and UML notations.
(4.77 - rated by 43 people)
At the initial stages of creating an IS, it is necessary to understand how the organization that is going to be automated works. No one in the organization knows how it works in the detail needed to create the IP. The manager knows the work well as a whole, but is not able to delve into the details of the work of each ordinary employee. An ordinary employee knows well what is going on at his workplace, but does not know how his colleagues work. Therefore, to describe the operation of an enterprise, it is necessary to build a model. Such a model must be adequate to the subject area; therefore, it must contain the knowledge of all participants in the organization’s business processes.
The most convenient language for modeling business processes is IDEF0, proposed more than 20 years ago by Douglas Ross (SoftTech, Inc.) and originally called SADT - Structured Analysis and Design Technique. (In the early 1970s, the US military used the process modeling subset of SADT to implement projects under the Integrated Computer-Aided Manufacturing (ICAM) program. This subset of SADT was subsequently adopted as a US federal standard under the name IDEF0. Detailed Specifications for IDEF standards can be found at http://www.idef.com.
In IDEF0, a system is represented as a collection of interacting activities or functions. This purely functional orientation is fundamental - the functions of the system are analyzed independently of the objects with which they operate. This allows you to more clearly model the logic and interaction of the organization’s processes.
A model in IDEF0 is understood as a description of a system (textual and graphical), which should answer some predetermined questions.
The simulated system is considered as an arbitrary subset of the Universe. It is arbitrary because, firstly, we ourselves speculatively determine whether a certain object will be a component of the system, or we will consider it as an external influence, and, secondly, it depends on the point of view of the system. The system has a boundary that separates it from the rest of the Universe. The interaction of a system with the outside world is described as input (something that is processed by the system), output (the result of the system's activities), control (the strategies and procedures under which the work is carried out) and mechanism (the resources necessary to carry out the work). While under control, the system converts inputs into outputs using mechanisms.
The process of modeling a system in IDEF0 begins with defining the context, that is, the most abstract level of description of the system as a whole. The context includes the definition of the subject of modeling, the purpose and point of view of the model.
The subject is understood as the system itself, and it is necessary to establish exactly what is included in the system and what lies outside it, in other words, we must determine what we will further consider as components of the system, and what as an external influence. The definition of the subject of the system will be significantly influenced by the position from which the system is viewed, and the purpose of the modeling - questions to which the constructed model should answer. In other words, it is initially necessary to determine the scope of the modeling. A description of the area of both the system as a whole and its components is the basis for constructing a model. Although it is assumed that the scope can be adjusted throughout the simulation, it must essentially be formulated initially, since it is the scope that determines the direction of the simulation and when the model should be completed. When formulating a scope, there are two components to consider—breadth and depth. Breadth involves defining the boundaries of the model - we determine what will be considered inside the system and what outside. Depth determines at what level of detail the model is complete. When determining the depth of the system, it is necessary not to forget about time limitations - the complexity of building a model grows exponentially with the depth of decomposition. Once the boundaries of the model are defined, it is assumed that no new objects should be introduced into the modeled system; Since all model objects are interconnected, introducing a new object can be not just an arithmetic addition, but can change existing relationships. Making such changes to a finished model is usually a very labor-intensive process (the so-called "floating region" problem).
Modeling Purpose. A model cannot be built without a clearly defined goal. The goal should answer the following questions:
Why should this process be modeled?
What should the model show?
What can the reader get?
Formulating a goal allows the analytics team to focus its efforts in the right direction. Examples of goal statements include the following statements: “Identify and define current problems, enable analysis of potential improvements,” “Identify the roles and responsibilities of employees for writing job descriptions,” “Describe the functionality of the enterprise for the purpose of writing information system specifications,” etc.
Viewpoint. Although the views of different people are taken into account when building a model, the model must be built from a single point of view. A point of view can be represented as the view of a person who sees the system in the aspect required for modeling. The point of view must correspond to the purpose of the modeling. Obviously, the description of the enterprise’s work from the point of view of a financier and a technologist will look completely different, so during the modeling it is important to remain on the chosen point of view. As a rule, the point of view of the person responsible for the simulated work as a whole is chosen. Often when choosing a perspective on a model, it is important to document additional alternative perspectives. FEO (For Exposure Only) charts are commonly used for this purpose.
The IDEF0 model assumes the presence of a clearly formulated goal, a single subject of modeling and a single point of view. To add scope, purpose and viewpoint to IDEF0 models in BPwin, select the menu item Edit/Model Properties, which brings up the Model Properties dialog (Fig. 4). Bookmarked Purpose you should add a goal and point of view, and bookmark Definition- definition of the model and description of the area.
Bookmarked Status In the same dialog, you can describe the status of the model (draft, working, final, etc.), the time of creation and last editing (later tracked automatically by the system date). Bookmarked Source the sources of information for building the model are described (for example, “Survey of subject matter experts and analysis of documentation”). Bookmark General serves to enter the name of the project and model, the name and initials of the author and the time frame of the model - AS-IS And TO-VE.
Rice. 4. Dialog for setting model properties
Models AS-IS and TO-BE. Usually, first, a model of the existing work organization is built - AS-IS (as is). Based on the AS-IS model, consensus is reached between the various business units on “who did what” and what each business unit adds to the process. The AS-IS model allows us to figure out “what we are doing today” before jumping to “what we will do tomorrow.” Analysis of the functional model allows you to understand where the weakest points are, what the advantages of new business processes will be, and how profound changes the existing structure of the business organization will undergo. Detailing business processes allows you to identify shortcomings of the organization even where the functionality seems obvious at first glance. Signs of ineffective activity can be useless, unmanaged and duplicative work, ineffective document flow (the right document is not in the right place at the right time), lack of feedback on management (the work is not affected by its result), input (objects or information are used irrationally ) etc. The shortcomings found in the AS-IS model can be corrected when creating the TO-BE (as will be) model - a model of a new organization of business processes. The TO-BE needs the model to analyze alternative/better ways of doing work and document how the company will do business in the future.
A common mistake to point out when creating an AS-IS model is creating an idealized model. An example would be the creation of a model based on the knowledge of the manager, and not a specific performer of work. The manager is familiar with how work is supposed to be done according to manuals and job descriptions and often does not know how subordinates actually perform routine work. The result is an embellished, distorted model that carries false information and cannot be used for further analysis. This model is called SHOULD_BE (as it should be).
IS design technology involves first creating an AS-IS model, analyzing it and improving business processes, i.e. creating a TO-BE model, and only on the basis of the TO-BE model is a data model, a prototype and then the final version of the IS built. Building a system based on the AS-IS model leads to automation of the enterprise according to the principle of “leaving everything as is, just to keep the computers standing,” i.e. IS automates imperfect business processes and duplicates, rather than replaces, existing document flow. As a result, the implementation and operation of such a system only leads to additional costs for the purchase of equipment, creation of software and maintenance of both.
Sometimes the current AS-IS and future TO-BE models are very different, so that the transition from the initial to the final state is not obvious. In this case, a third model is needed to describe the process of transition from the initial to the final state of the system, since such a transition is also a business process.
The result of the model description can be obtained in the report Model Report. The model report settings dialog is called from the menu item Report/Model Report. In the settings dialog, you should select the required fields, and the order in which information is output to the report is automatically displayed (Fig. 5).

Rice. 5. Model report
IDEF0 diagrams. The IDEF0 methodology is based on a graphical language for describing business processes. A model in IDEF0 notation is a collection of hierarchically ordered and interconnected diagrams. Each diagram is a unit of description of the system and is located on a separate sheet.
The model can contain four types of diagrams:
context diagram (each model can have only one context diagram);
decomposition diagrams;
node tree diagrams;
exposure-only (FEO) charts.
The context diagram is the top of the tree structure of diagrams and represents the most general description of the system and its interaction with the external environment. After describing the system as a whole, it is divided into large fragments. This process is called functional decomposition, and the diagrams that describe each fragment and the interaction of the fragments are called decomposition diagrams. After decomposing the context diagram, each large fragment of the system is decomposed into smaller ones, and so on, until the desired level of detail in the description is achieved. After each decomposition session, examination sessions are conducted - subject matter experts indicate the correspondence of real business processes to the created diagrams. Any inconsistencies found are corrected, and only after passing the examination without any comments can the next decomposition session begin. This ensures that the model matches real business processes at any and every level of the model. The syntax for describing the system as a whole and each of its fragments is the same throughout the model.
A node tree diagram shows the hierarchical dependency of activities, but not the relationships between activities. There can be as many node tree diagrams in the model as desired, since the tree can be built to an arbitrary depth and not necessarily from the root.
Exposure diagrams (FEO) are constructed to illustrate parts of a model, to illustrate an alternative point of view, or for special purposes.
An example of creating a functional model.
As an example, the activities of the fictional company “Computer Word” are considered. The company primarily assembles and sells desktop computers and laptops. The company does not produce components itself, but only assembles and tests computers.
The main types of work in the company are as follows:
sellers accept customer orders;
operators group orders by computer type;
operators assemble and test computers;
operators pack computers according to orders;
The storekeeper ships orders to customers.
The company uses a licensed accounting information system that allows you to place an order, an invoice and track invoice payments.
Method of doing the work
1. Run BPwin().
2. If a dialog appears ModelMart Connection Manager, click on the button Cancel(Cancel).
3. Click the button. A dialog box appears I would like to(Fig. 6). Type in text field Name model name "Company Activity" and select Type – Business Process (IDEF0). Click the button OK.

Rice. 6. Naming the model and selecting the model type
4. A dialog box will open Properties for New Models(Properties of the new model) (Fig. 7). Enter in the text field Author(Author) name of the author of the model and in the text field Author initials his initials. Press the buttons in sequence Apply And OK.

5. A blank context diagram is automatically created (Fig. 8).
6. Notice the button on the toolbar. This button turns the browsing and navigation tool on and off - Model Explorer(Model browser). Model Explorer has three tabs - Activities (), Diagrams() And Objects(). In the tab Activities Right-clicking an object in the model browser allows you to select options for editing its properties (Fig. 9).

Rice. 8. Blank context diagram

Rice. 9. Right-clicking an object in the Activities tab allows you to use the context menu to edit its properties
7. Go to menu Model/Model Properties. In the tab General dialog box Model Properties to text field Model name you should enter the name of the model “Company Activities”, and in the text field Project the name of the project "Model of the company's activities", and, finally, in the text Time Frame(Time coverage) - AS-IS(As is) (Fig. 10).

Rice. 10. Window for setting model properties
8. In the tab Purpose dialog box Model Properties to text field Purpose(goal) enter data about the purpose of developing the model - “To model current (AS-IS) business processes of the company”, and in the text field Viewpoint(point of view) - “Director” (Fig. 11).

Rice. 11. Entering data about the purpose of modeling and point of view
9. In the tab Definition dialog box Model Properties to text field Definition(Definition) enter “This is a training model that describes the activities of a company” in the text field Scope(coverage) - “General management of the company’s business: market research, procurement of components, assembly, testing and sales of products” (Fig. 12).
10. Go to the context diagram and right-click on the rectangle representing, in the notation IDEF0, conventional graphic designation of work. From the context menu, select the option Name(Fig. 13). In the tab Name enter the name “Company Activities” (Fig. 14).
11. In the tab Definition dialog box Activity Properties to text field Definition(Definition) enter “Current business processes of the company” (Fig. 15). Text field Note(Notes) leave blank.

Rice. 12. Entering additional data defining the model

Rice. 13. Context menu for working with the selected Name option

Rice. 14. Naming the work

Rice. 15. Entering additional data about the work
12. Create ICOM-arrows on the context diagram (Table 1).
Table 1 - Context diagram arrows
|
Arrow name (ArrowName) |
Arrow definition (ArrowDefinition) |
Arrow type (ArrowType) |
|
Customer calls |
Requests for information, orders, technical support, etc. | |
|
Rules and procedures |
Sales rules, assembly instructions, testing procedures, performance criteria, etc. | |
|
Products sold |
Desktops and laptops | |
|
Accounting system |
Preparation of invoices, payment of bills, work with orders |
13. Using the button, enter text in the diagram field - point of view and goal (Fig. 16).

Rice. 16. Entering text into a chart field using the Text Block Editor
14. Create a report on the model. On the menu Tools/Reports/Model Report(Fig. 17) set the report generation options (check the boxes) and click the button Preview(Preview) (Figure 18).

Rice. 17. Setting options for generating a Model Report

Rice. 18. Model Report Preview
Decomposition of production processes according to methodologyIDEF0
Works (Activity)
Activities refer to named processes, functions, or tasks that occur over a period of time and have recognizable results. Works are depicted as rectangles. All works must be named and defined. The name of the work must be expressed as a verbal noun denoting the action (for example, “Making a part,” “Receiving an order,” etc.). The work “Production of a part” may have, for example, the following definition: “The work refers to the full cycle of manufacturing a product from quality control of raw materials to shipment of the finished packaged product.” When creating a new model (menu File/New) a context diagram is automatically created with a single work depicting the system as a whole (Fig. 1).
To enter a job name, right-click on the job and select from the menu Name Editor and in the dialog that appears, enter the name of the work. To describe other properties of the work, use the dialog Activity Properties(Fig. 2).

Rice. 1. Example of a context diagram

Rice. 2. Editor for setting job properties
Decomposition diagrams contain related work, i.e. child jobs that have a common parent job. To create a decomposition diagram, click on the button.
A dialogue arises Activity Box Count(Fig. 3), in which you should indicate the notation of the new diagram and the number of works on it. Let's choose a notation IDEF0 and click on OK. A decomposition diagram appears (Fig. 4). The acceptable range of number of jobs is 2-8. It makes no sense to decompose work into one task: diagrams with more than eight tasks turn out to be oversaturated and difficult to read. To ensure clarity and better understanding of the simulated processes, it is recommended to use from three to six blocks on one diagram.

Rice. 3. DialogueActivity Box Count

Rice. 4. Example of a decomposition diagram
If it turns out that the number of works is not enough, then the work can be added to the diagram by first clicking on the button on the tool palette, and then on an empty space on the diagram.
Activities on breakdown diagrams are usually arranged diagonally from the top left to the bottom right.
This order is called the order of dominance. According to this arrangement principle, the most important work or the work that is completed first in time is located in the upper left corner. Further down to the right are less important or later tasks. This arrangement makes the diagrams easier to read, and the concept of work relationships is based on it.
Each of the activities on the decomposition diagram can be decomposed in turn. In a breakdown diagram, work is numbered automatically from left to right. The job number is shown in the lower right corner. There is a small diagonal line in the upper left corner, which indicates that this work has not been decomposed. So, for example, the work “Assembling a product” has number 3 and has not yet been decomposed. Work "Quality Control" (number 4) has a lower level of decomposition
Arrows
The interaction of works with the outside world and with each other is described in the form of arrows. Arrows represent some information and are called nouns (for example, “Product”, “Product”, “Order”).
There are five types of arrows in IDEF0:
Input- material or information that is used or transformed by work to produce a result (output). It is allowed that the work may not have a single entry arrow. Each type of arrow approaches or leaves a specific side of the rectangle representing the work. The entry arrow is drawn as entering the left edge of the work. When describing technological processes (this is why IDEF0 was invented), there are no problems identifying inputs. Indeed, “Raw materials” in Fig. 1. is something that is processed during the “Product Making” process to produce a result. When modeling an IP, when the arrows are not physical objects, but data, not everything is so obvious. For example, during a “Patient Reception”, the patient’s card can be both at the input and at the output, meanwhile the quality of this data changes. In other words, in this example, in order to justify its purpose, the input and output arrows must be precisely defined to indicate that the data has actually been processed (eg, the output is "Completed Patient Record"). It is often difficult to determine whether data is input or control. In this case, a clue can be whether the data is processed/changed in the work or not. If they change, then most likely it is an input; if not, it is control.
Control- rules, policies, procedures or standards that guide work. Each job must have at least one control arrow. The control arrow is drawn as entering the top edge of the work. In Fig. 1 arrows “Task” and “Drawing” - control for the work “Manufacture of a product”. Management influences work, but is not transformed by work. If the goal of a job is to change a procedure or strategy, then that procedure or strategy will be the input to the job. If there is uncertainty in the status of an arrow (control or input), it is recommended to draw a control arrow.
Output- the material or information that is produced by the work. Each job must have at least one exit arrow. Work without results has no meaning and should not be modeled. The exit arrow is drawn as emanating from the right edge of the work. In Fig. 1 arrow "Finished product" is the output for the work "Product manufacturing".
Mechanism- resources that perform the work, for example, enterprise personnel, machines, devices, etc. The mechanism arrow is drawn as included in the lower edge of the work. In Fig. 1 arrow "Enterprise personnel" is a mechanism for the work "Product manufacturing". At the discretion of the analyst, the arrows of the mechanism may not be depicted in the model.
Call- a special arrow pointing to a different operating model. The call arrow is drawn as emanating from the bottom edge of the work. In Fig. 1 arrow "Other work model" is a call for the work "Product manufacturing". A call arrow is used to indicate that some work is being performed outside of the system being modeled. In BPwin, call arrows are used in the mechanism for merging and splitting models.
Border arrows. The arrows on the context diagram are used to describe the interaction of the system with the outside world. They can start at the border of the diagram and end at the work, or vice versa. Such arrows are called boundary arrows.
To add a boundary entry arrow:
Control, output, mechanism and output arrows are depicted similarly. To draw an exit arrow, for example, click the arrow symbol button in the Tools palette, click on the right side of the work on the exit side (where the arrow starts), move the cursor to the right side of the screen until the initial dashed line appears, and click once along the dashed strip.
The names of newly added arrows are automatically entered into the dictionary ( Arrow Dictionary).
ICOM codes. A breakdown diagram is designed to detail the work. Unlike models that display the structure of an organization, the work on the top-level diagram in IDEF0 is not a control over the work below it. Lower-level work is the same as upper-level work, but in more detail. As a consequence, the boundaries of a top-level work are the same as the boundaries of a decomposition diagram. ICOM(abbreviation for Input, Control, Output and Mechanism) - codes intended to identify boundary arrows. Code ICOM contains a prefix corresponding to the arrow type ( I,WITH,ABOUT or M), and serial number. BPwin enters ICOM codes automatically. To display ICOM codes, enable the Show ICOM codes option on the tab Presentation dialogue Model Properties.
The arrow dictionary is edited using a special editor Arrow Dictionary Editor, in which the arrow is defined and a comment related to it is entered (Fig. 6). The arrow dictionary solves a very important problem. Diagrams are created by an analyst in order to conduct an examination session, i.e., discuss the diagram with a subject matter specialist. In any subject area, professional jargon is formed, and very often jargon expressions have an unclear meaning and are perceived differently by different specialists. At the same time, the analyst - the author of the diagrams - must use those expressions that are most understandable to experts. Since formal definitions are often difficult to understand, the analyst is forced to use professional jargon, and in order to avoid ambiguous interpretations, in the arrow dictionary each concept can be given an expanded and, if necessary, formal definition.
The contents of the arrow dictionary can be printed as a report (menu Report/Arrow Report...) and thereby obtain an explanatory dictionary of domain terms used in the model.

Rice. 5. DialogueArrow Properties

Rice. 6. Vocabulary arrows
Unconnected border arrow. When decomposing a work, the arrows entering and leaving it (except for the call arrow) automatically appear on the decomposition diagram (migration of arrows), but do not touch the works. Such arrows are called unlinked and are treated as a syntax error in BPwin. To link input, control or mechanism arrows, you must go into arrow editing mode, click on the arrowhead and click on the corresponding work segment. To link an output arrow, you must go into arrow editing mode, click on the work output segment and then on the arrow.
Inner arrows. To connect the works with each other, internal arrows are used, i.e. arrows that do not touch the border of the diagram begin at one work and end at another.
To draw an internal arrow, you must, in arrow drawing mode, click on a segment (for example, exit) of one work and then on a segment (for example, input) of another. IDEF0 distinguishes five types of work relationships.
Output-input communication, when the output arrow of the higher-level work (hereinafter referred to as simply the output) is directed to the input of the lower-level one.
Control communication (output-control), when the output of a higher-level operation is sent to control the lower one. Management communication shows the dominance of higher-level work. The data or output objects of the higher-level work are not changed in the lower-level work.
Output-input feedback, when the output of a lower-level work is sent to the input of a higher-level one. Such a relationship is usually used to describe cycles.
Output-control feedback, when the output of a lower-level operation is sent to the control of a higher-level one. Management feedback often indicates the effectiveness of a business process.
Output-mechanism connection, when the output of one job is sent to the mechanism of another. This relationship is used less frequently than others and shows that one activity prepares the resources needed to carry out another activity.
Explicit arrows. An explicit arrow has a single job as its source and a single job as its destination.
Branching and merging arrows. The same data or objects generated by one job can be used in several other jobs at once. On the other hand, arrows generated in different works may represent the same or homogeneous data or objects that are further used or processed in one place. To model such situations, IDEF0 uses branching and merging arrows. To branch an arrow, in the arrow editing mode, click on the arrow fragment and on the corresponding segment of work. To merge two exit arrows, in arrow editing mode, first click on the work exit segment, and then on the corresponding arrow fragment.
The meaning of branching and merging arrows is conveyed by the naming of each branch of the arrows. There are certain rules for naming such arrows. Let's look at them using branching arrows as an example. If an arrow is named before the branch, but after the branch no branches are named, then each branch is assumed to model the same data or objects as the branch before the branch.
If an arrow is named before a branch, but after the branch any of the branches are not named, then it is assumed that these branches correspond to the naming. If any branch after the branch remains unnamed, then it is assumed that it models the same data or objects as the branch before the branch.
The situation is unacceptable when the arrow is not named before the branch, and after the branch any of the branches is not named. BPwin detects such an arrow as a syntax error.
The rules for naming merging arrows are completely similar - an arrow that is not named after the merger, and any of its branches is not named before the merger, will be considered an error. To name a separate branch of branching and merging arrows, select only one branch in the diagram, then call the name editor and assign a name to the arrow. This name will only match the selected branch.
Arrow tunneling. Newly introduced boundary arrows are shown in square brackets on the lower-level decomposition diagram and do not automatically appear on the top-level diagram.
To “drag” them to the top, you must first select the button on the tool palette and click on the square brackets of the border arrow. A dialogue appears Border Arrow Editor(Fig. 7).

Rice. 7. DialogueBorder Arrow Editor
If you click on the button ResolveBorderArrow, the arrow migrates to the top-level diagram if the ChangeToTunnel button is used - the arrow is tunneled and does not end up on another diagram.
Tunneling can be used to depict unimportant arrows. If on any lower-level diagram it is necessary to depict unimportant data or objects that are not processed or used by work at the current level, then they must be sent to a higher level (to the parent diagram). If this data is not used in the parent chart, it needs to be sent even higher, etc. As a result, an insignificant arrow will be drawn at all levels and will make it difficult to read all the charts on which it appears. The solution is to tunnel the arrow at the lowest level. This tunneling is called "not-in-parent-diagram".
Example of creating a decomposition diagram
1. Select the down button in the tool palette and in the dialog box Activity Box Count(Fig. 8) set the number of jobs on the lower level diagram - 3 - and click the button OK.

Rice. 8. Activity Box Count Dialog Box
2. A decomposition diagram will be created automatically (Fig. 9).

Rice. 9. Decomposition diagram
Right-click on the work located in the upper left corner of the model editing area, select the option in the context menu Name and enter the job name. Repeat the operation for the remaining two jobs. Then enter the definition, status, and source for each work as shown in Table 1.
Table 1. Works of the A0 decomposition diagram
The decomposition diagram will take the form shown in Fig. 10.

Fig. 10 Decomposition diagram after assigning names to works
3. To change the properties of jobs after they are included in the diagram, you can use the jobs dictionary (Fig. 11). The dictionary is called using the main menu item Dictionary/Activity.

Rice. 11. DictionaryActivity Dictionary
If you describe the name and properties of the work in the dictionary, you can add it to the diagram later using a button in the tool palette. It is not possible to remove a work from the dictionary if it is used in any diagram. If a work is removed from the chart, it is not removed from the dictionary. The name and description of such work may be used later. To add a work to the dictionary, go to the end of the list and right-click on the last line. A new line appears in which you need to enter the name and properties of the job. To delete all job names that are not used in the model, click the button ( Purge(Clean)).
4. Switch to arrow drawing mode and link the boundary arrows using the button on the tool palette as shown in Fig. 12.

Rice. 12. Connected boundary arrows on the A0 diagram
5. Right-click on the control arrow branch of the “Building and testing computers” work and rename it to “Build and testing rules” (Fig. 13). Enter a definition for the new branch: "Build instructions, testing procedures, performance criteria, etc." Right-click on the arrow branch of the “Sales and Marketing” work mechanism and rename it as “Ordering System” (Fig. 14).

Rice. 13. Arrow "Build and test rules"

Rice. 14. Arrow "Ordering system"
6. An alternative method of entering names and properties of arrows is to use the arrow dictionary (call the dictionary - menu Dictionary/Arrow). If you enter the name and properties of the arrow into the dictionary (Fig. 15), it can be added to the diagram later.

Rice. 15. Vocabulary arrows
An arrow cannot be removed from the dictionary if it is used in any diagram. Removing an arrow from a diagram does not remove it from the dictionary. The name and description of such an arrow can be used later. To add an arrow, go to the end of the list and right-click on the last line. A new line appears in which you need to enter the name and properties of the arrow.
7. Create new internal arrows as shown in Fig. 16.

Rice. 16. Inner arrows of A0 diagram
8. Create a (management) feedback arrow for Build and Test Results from the Computer Build and Test activity to the Sales and Marketing activity. Change the arrow style (line thickness) if necessary and set the option Extra Arrowhead(Additional Arrowhead) (from the context menu). Method drag&drop move the names of the arrows so that they are easier to read. If necessary, install from the context menu Squiggle(Zagogulin). The result of possible changes is shown in Fig. 17.

Rice. 17. Result of editing arrows on diagram A0
9. Create a new Marketing Materials exit boundary arrow coming out of the Sales and Marketing job. This arrow does not automatically fall into the top-level diagram and has square brackets at the tip (Figure 18).

Rice. 18. Arrow Marketing materials
10. Right-click on the square brackets and select the menu item Arrow Tunnel(Fig. 19).
In the dialog box Border Arrow Editor(Boundary Arrow Editor) select option Resolve it to Border Arrow(Allow as Boundary Arrow) (Fig. 20).

Rice. 19. ParagraphmenuArrow Tunnel

Rice. 20. DialoguewindowBorder Arrow Editor
For the Marketing Materials arrow, select the option Trim(Arrange) from the context menu. The result of the laboratory work is shown in Fig. 21.

Rice. 21. Result of decomposition
Keywords: structural analysis and design, functional model, functional block, interface arc, context diagram, decomposition, glossary, goal, point of view, identification of subprocesses, decomposition, complexity limitation, tunneling.
Definition
IDEF0 (Integration Definition for Function Modeling) – a functional modeling methodology for describing enterprise functions, offering a functional modeling language for analysis, development, reengineering and integration of business process information systems; or software engineering analysis.
The IDEF0 methodology is a development of the structural analysis and design method SADT (Structured Analysis and Design Technique).
IDEF0 as a standard was developed in 1981 as part of the ICAM (Integrated Computer Aided Manufacturing) program.
IDEF0 – Integration DEFinition language 0 – is based on SADT and in its original form includes simultaneously: a definition of a graphical modeling language (syntax and semantics) and a description of a comprehensive model development methodology.
The latest revision of IDEF0 was released in December 1993 by the US National Institute of Standards and Technology (NIST).
IDEF0 was adopted as a federal standard in the United States in 1993, and as a standard in the Russian Federation in 2000.
Application of IDEF0
IDEF0 is used to create functional model, that is, the result of applying the IDEF0 methodology to the system is the IDEF0 functional model.
Functional model is a structural representation of functions, activities or processes within the modeled system or subject area.
The IDEF0 methodology can be used to model a wide range of both automated and manual systems.
For systems being designed, IDEF0 can be used to first define requirements and functions and then create an implementation that satisfies those requirements and performs those functions.
For existing systems, IDEF0 can be used to analyze the functions performed by the system, as well as to account for the mechanisms by which those functions are performed.
Goals of the IDEF0 Standard
Main objectives (objectives) of the standard:
document and explain the IDEF0 modeling technique and how to use it;
provide a means for completely and consistently modeling the functions of a system or domain, as well as the data and objects that connect these functions;
provide a modeling language that is independent of CASE methods or tools, but can be used using those methods and tools;
provide a modeling language that has the following characteristics:
general(generic) – for analysis of systems and subject areas;
strict and precise(rigorous and precise) – to create correct, usable models);
brief(concise) – to facilitate understanding, communication, agreement between stakeholders and verification. (to facilitate understanding, communication, consensus and validation);
abstract(conceptual) – to represent functional requirements independent of physical or organizational implementations;
flexible– to support various phases of the project life cycle.
Rigor and precision(Rigor and Precision)
The IDEFØ rules require sufficient rigor and precision to satisfy the needs without overly constraining the analyst. IDEFØ rules include the following:
control of the details communicated at each level – from three to six functional blocks at each level of decomposition;
Bounded Context – there should be no missing or unnecessary details that go beyond the established framework;
Diagram Interface Connectivity – numbers of nodes, functional blocks, C-numbers and Detail Reference Expression);
data structure coherence. (Data Structure Connectivity) – ICOM codes and the use of parentheses;
Unique Labels and Titles – no duplicate names;
syntax rules for graphics (Syntax Rules for Graphics) – function blocks and arrows;
restrictions on data arrow branches (Data Arrow Branch Constraint) – labels for restrictions on data flows on branches;
separation of data into Input versus Control Separation – a rule for determining the role of data);
data arrow markings. Data Arrow Label Requirements (minimum labeling rules);
presence of Control (Minimum Control of Function) – all functions must have at least one Control;
Purpose and Viewpoint – all models have a statement of purpose and point of view.
IDEF0 Basic Concepts
The methodology is based on four main concepts:
functional block;
interface arc;
decomposition;
glossary.
Function block(Activity Box) represents some specific function within the system in question.
According to the requirements of the standard, the name of each functional block must be formulated in the verbal mood (for example, “produce services”).
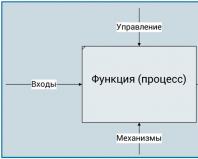
In the diagram, a functional block is depicted as a rectangle (Fig.). Each of the four sides of the functional block has its own specific meaning (role), and:
the top side is set to “Control”;
the left side is set to “Input”;
the right side is set to “Output”;
the bottom side has the meaning “Mechanism”.
Rice. Function block
Interface arc/arrow(Arrow) displays a system element that is processed by a function block or otherwise affects the function represented by that function block. Interface arcs are often called flows or arrows.
Using interface arcs, various objects are displayed that, to one degree or another, determine the processes occurring in the system. Such objects can be elements of the real world (parts, cars, employees, etc.) or flows of data and information (documents, data, instructions, etc.).
Depending on which side of the functional block this interface arc fits, it is called “incoming”, “outgoing” or “controlling”.
It should be noted that any functional block, according to the requirements of the standard, must have at least one control interface arc and one outgoing one. This is understandable - each process must occur according to some rules (displayed by the control arc) and must produce some result (outgoing arc), otherwise its consideration does not make any sense.
The mandatory presence of control interface arcs is one of the main differences between the IDEF0 standard and other methodologies of the DFD (Data Flow Diagram) and WFD (Work Flow Diagram) classes.
Decomposition(Decomposition) is a core concept of the IDEF0 standard. The principle of decomposition is used when breaking a complex process into its component functions. In this case, the level of detail of the process is determined directly by the model developer.
Decomposition allows you to gradually and structuredly present the system model in the form of a hierarchical structure of individual diagrams, which makes it less overloaded and easier to digest.
The last of the IDEF0 concepts is glossary(Glossary).
For each of the IDEF0 elements - diagrams, function blocks, interface arcs - the existing standard requires the creation and maintenance of a set of corresponding definitions, keywords, narrative statements, etc. that characterize the object displayed by this element.
This set is called glossary and is a description of the essence of this element. The glossary harmoniously complements the visual graphic language, providing the diagrams with the necessary additional information.
Modeling. The IDEF0 model always begins with a view of the system as a single whole—one functional unit with interface arcs extending beyond the domain under consideration. Such a diagram with one functional block is called context diagram.
The explanatory text for the context diagram must indicate target(Purpose) to construct a diagram in the form of a brief description and recorded point of view(Viewpoint).
Definition and formalization goals development of the IDEF0 model is an extremely important point. In effect, the goal defines the relevant areas in the system under study that need to be focused on first.
Point of view determines the main direction of model development and the level of required detail. A clear fixation of the point of view allows you to unload the model by refusing to detail and study individual elements that are not necessary, based on the chosen point of view on the system.
 (1 ratings, on average: 5,00 out of 5)