Ros coefficient shows. What profitability is considered normal: calculation rules and definitions
The level of economic efficiency of a financial, labor or material resource is characterized by such a relative indicator as profitability. It is expressed as a percentage and is widely used to evaluate the performance of a business enterprise. There are many types of this concept. Any of them is the ratio of profit to the asset or resource under study.
The essence of the concept of profitability ratio
The return on sales ratio shows the business activity of the enterprise and reflects the efficiency of its work. Evaluation of the indicator allows you to determine how much money from product sales is the company’s profit. What matters is not how much product was sold, but how much net profit the company earned. Using the indicator, you can also find the share of cost in sales.
The return on sales ratio is usually analyzed over time. A rise or fall in an indicator indicates various economic phenomena.
If profitability increases:
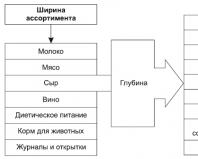
- An increase in revenue occurs more quickly than an increase in costs (either sales volumes have increased or the assortment has changed).
- Costs are decreasing faster than revenue is decreasing (the company has either raised product prices or changed the assortment structure).
- Revenue grows, but costs become lower (prices have increased, the assortment has changed, or cost standards have changed).
The first two situations are definitely favorable for the company. Further analysis is aimed at assessing the sustainability of this situation.
The second situation for the company cannot be called unambiguously favorable. After all, the profitability indicator has formally improved (revenue has decreased). To make decisions, pricing and assortment are analyzed.
If profitability has decreased:
- Costs grow faster than revenue (due to inflation, lower prices, increased cost standards, or changes in product mix).
- The decline in revenue occurs faster than the reduction in costs (sales have fallen).
- Revenue becomes less, and costs increase (cost rates have increased, prices have decreased, or the assortment has changed).
The first trend is clearly unfavorable. Additional analysis of the reasons is needed to correct the situation. The second situation indicates the company's desire to reduce its sphere of influence in the market. If a third trend is detected, pricing, assortment, and cost control systems need to be analyzed.
How to Calculate Return on Sales in Excel
The international designation of the indicator is ROS. The return on sales ratio is always calculated based on sales profit.
Traditional formula:
ROS = (profit/revenue) * 100%.
In specific situations, it may be necessary to calculate the share of gross, book or other profit in revenue.
Formula for gross return on sales (margin):
(Gross profit / sales revenue) * 100%.
This indicator shows the level of “dirty” money (before all deductions) earned by the company from the sale of products. The elements of the formula are taken in monetary terms. Gross profit and revenue can be found on the income statement.
Information for calculation:
In the cells for calculating gross profitability, we will set the percentage format. Enter the formula:

The gross profit margin indicator for 3 years is relatively stable. This means that the company carefully monitors pricing procedures and monitors the product range.
Operating profit margin (EBIT):
(Operating profit / sales revenue) * 100%.
The indicator characterizes how much operating profit is per ruble of revenue.
((Page 2300 + Page 2330) / Page 2110) * 100%.
Data for calculation:

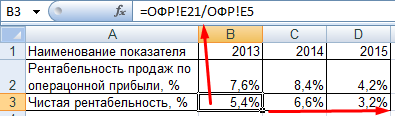
Let's calculate the profitability of operating profit - substitute references to the required cells into the formula:

Formula for return on sales based on net profit:
(Net profit / revenue) * 100%.
Net profitability shows how much net profit is per ruble of revenue. Both figures are taken from the income statement.
Let's show the return on sales ratio on the graph:
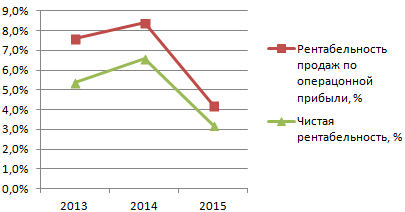
In 2015, the indicator decreased significantly, which is regarded as an unfavorable phenomenon. Additional analysis of the assortment list, pricing and cost control system is required.
A value above zero is considered normal. The more specific range depends on the field of activity. Each enterprise compares its return on sales ratio and the standard value for the industry. It’s good if the calculated indicator practically does not differ from the inflation rate.
 To analyze and calculate the efficiency of an enterprise, a wide range of economic and financial indicators is used. They differ in the complexity of calculation, availability of data and usefulness for analysis.
Profitability is one of the optimal performance indicators - ease of calculation, availability of data and enormous usefulness for analysis make this indicator a must-have for calculation.
What is enterprise profitability
Profitability (RO – returnon)– a general indicator of the economic efficiency of an enterprise or the use of capital/resources (material, financial, etc.). This indicator is necessary for analyzing economic activities and for comparison with other enterprises.
Profitability, unlike profit, is a relative indicator, so the profitability of several enterprises can be compared with each other.
Profit, revenue and sales volume are absolute indicators or economic effects and it is incorrect to compare these data from several enterprises, because such a comparison will not show the true state of affairs.
Perhaps an enterprise with a smaller sales volume will be more efficient and sustainable, that is, it will bypass another enterprise in terms of relative indicators, which is more important. Profitability is also compared with efficiency(efficiency factor).
In general, profitability shows how many rubles (kopecks) of profit one ruble invested in assets or resources will bring. For profitability of sales, the formula reads as follows: how many kopecks of profit are contained in one ruble of revenue. Measured as a percentage, this indicator reflects the effectiveness of activities.
There are several main types of profitability:
- profitability of products/sales (ROTR/ROS – total revenue/sale),
- return on cost (ROTC – total cost),
- return on assets (ROA – assets)
- return on investment (ROI – invested capital)
- personnel profitability (ROL – labor)
The universal formula for calculating profitability is as follows:
RO=(Type of profit/Indicator whose profitability needs to be calculated)*100%
In the numerator, the type of profit is most often used profit from sales (from sales) and net profit, but it is possible to calculate balance sheet profit and. All types of profit can be found on the income statement (profit and loss).
The denominator is the indicator whose profitability needs to be calculated. The indicator is always in monetary terms. For example, find the return on sales (ROTR), that is, the denominator should include the sales volume indicator in value terms - this is revenue (TR - total revenue). Revenue is found as the product of price (P – price) and sales volume (Q – quantity). TR=P*Q.
Formula for calculating production profitability
Return on cost (ROTC – returnontotalcost)– one of the main types of profitability necessary for efficiency analysis. Cost profitability is also called production profitability, as this indicator reflects the efficiency of the production process.
Production profitability (cost) is calculated using the following formula:
ROTC=(PR/TC)*100%
The numerator contains profit from sales/sales (PR), which is the difference between income (revenue - TR - totalrevenue) and expenses (total cost - TC - totalcost). PR=TR-TC.
In the denominator, the indicator whose profitability needs to be found is the total cost (TC). The total cost consists of all the costs of the enterprise: costs of materials, semi-finished products, wages of workers and administrative and management personnel, electricity and other housing and communal services, shop and factory costs, costs of advertising, security, etc.
The largest share of the cost is made up of materials, which is why the main industries are called material-intensive.
Return on cost shows how many kopecks of profit from sales will be brought by one ruble invested in the cost of production. Or, measured as a percentage, this indicator reflects how efficient the use of production resources is.
Formula for calculating profitability on balance sheet
Many types of profitability are calculated based on balance sheet data. The balance sheet contains information about the assets, liabilities and equity of an organization.
This form is compiled 2 times a year, that is, the status of any indicator can be viewed at the beginning of the period and at the end of the period. To calculate profitability from the balance sheet, the following indicators are required:
- assets (current and non-current);
- the amount of equity capital;
- investment size;
- and etc.
You cannot simply take any of these indicators and calculate profitability - this is wrong!
In order to correctly calculate profitability, you need to find the arithmetic average of the amount of the indicator at the beginning of the current (end of the previous) and the end of the current period.
For example, find the profitability of non-current assets. The sum of the values of non-current assets at the beginning and end of the period is taken from the balance sheet and divided in half.
In the balance sheet of medium-sized enterprises, the value of non-current assets is reflected in line 190 - Total for section I; for small enterprises, the value of non-current assets is the sum of lines 1150+1170.
The formula for return on non-current assets is as follows:
ROA (in) = (PR/(VnA np + VnA kp)/2)*100%,
where VnA np is the value of non-current assets at the beginning of the current (end of the previous) period, VnA kp is the value of non-current assets at the end of the current period.
The return on non-current assets shows how many kopecks of profit from sales will be brought by one ruble invested in non-current assets.
Example of calculating production profitability
To calculate the profitability of production, the following indicators are required: total cost (TC) and profit from sales (PR). The data is presented in the table.
PR 1 =TR-TC=1500000-500000=1,000,000 rubles
PR 2 =TR-TC=2400000-1200000=1,200,000 rubles
Obviously, the second enterprise has higher revenue and profit from sales. When measured in absolute terms, the effect of the second enterprise is higher. But does this mean that the second enterprise is more effective? To answer this question, production is necessary.
ROTC 1 =(PR/TC)*100%=(1000000/500000)*100%=200%
ROTC 2 =(PR/TC)*100%=(1200000/1200000)*100%=100%
The profitability of production of the first enterprise is 2 times higher than the profitability of production of the second enterprise. We can confidently say that the production of the first enterprise is 2 times more efficient than that of the second.
Profitability, as an indicator of the efficiency of an enterprise, more accurately reflects the real state of affairs in production, sales or investment of the enterprise, allowing you to correctly respond to the current situation, in contrast to the use of absolute indicators, which do not give a complete picture.
Globally, profitability is a set of indicators that collectively characterize the efficiency of a business, or rather its profitability. Profitability is always the ratio of profit to the object whose effect you want to know. In fact, this is the share of profit per unit of the analyzed object.
Using profitability indicators, you can find out how effectively the equity capital or assets of the enterprise are used ( see “Determining return on assets (balance sheet formula)” ), whether its production is profitable. But in this article we will focus directly on the profitability of sales.
Return on sales is the ratio of profit to revenue
Return on sales gives an idea of the share of profit in the company's revenue. In analysis, it is usually referred to as ROS (short for return on sales).
The general formula for return on sales is as follows:
ROS = Pr / Op × 100%,
where: ROS - return on sales;
Pr - profit;
Op - sales volume or revenue.
Return on sales is a relative indicator; it is expressed as a percentage.
How to calculate return on sales on balance sheet
To calculate the profitability of sales, information from the financial results report (Form 2) is used.
Read the article about form 2 “Filling out Form 2 of the balance sheet (sample)” .
In this case, the formula for profitability of sales on the balance sheet depends on what profitability the user is interested in:
- Gross profit margin. In this case, the formula for calculating profitability of sales will be as follows:
ROS = line 2100 / line 2110 × 100.
- Operating profit margin:
ROS = (line 2300 + line 2330) / line 2110 × 100.
- Net profit margin:
ROS = line 2400 / line 2110 × 100.
What is the standard value of return on sales?
There are no special standards for profitability of sales. Average statistical values of profitability by industry are calculated. For each type of activity, its own coefficient is considered normal.
In general, a coefficient ranging from 1 to 5% indicates that the enterprise is low-profitable, from 5 to 20% is medium-profitable, and from 20 to 30% is highly profitable. Over 30% is already super-profitability.
In a general sense, profitability includes a set of indicators that comprehensively characterize the efficiency (profitability) of a business.
Profitability is always the ratio of profit to that object, the analysis of the influence of the effect of which needs to be clarified. In fact, the formula for return on sales on the balance sheet determines the share of profit per unit of the object in question.
Using the formula for return on sales on the balance sheet, you can find out with what degree of efficiency equity capital (company assets), fixed and working capital, etc. is used.
Return on sales shows what part of the profit is in the organization's revenue. In the analysis, return on sales is denoted by ROS (from the English returnonsales).
General sales return formula as follows:
ROS = P / Qp * 100%,
Here ROS is return on sales;
P is the amount of profit;
Qп - sales volume (revenue).

Return on sales is a relative indicator, determined as a percentage.
Formula for return on sales on balance sheet
When calculating the profitability of sales on the balance sheet, information is taken from the financial results report (form No. 2).
In this case balance sheet return on sales formula depends on the type of profitability that users need:
- Gross Profit Margin:
ROS=p.2100/p. 2110 * 100%
- Operating profit margin:
ROS=(p.2300 + p.2330)/p. 2110 * 100%
- Net profit margin:
Standard value of return on sales
When calculating the profitability of sales, there are no specific standards, since the average statistical values of profitability by industry are calculated. Each type of activity has corresponding norm coefficients.
In general, the formula for profitability of sales on the balance sheet should provide a profitability standard ranging from 20 to 30%, which reflects the high profitability of the enterprise.
An indicator of up to 5% indicates low profitability of the company, from 5 to 20% - average profitability, a profitability indicator of more than 30% indicates super-profitability.
Average return on sales by industry in our country:
- Agriculture – 10-13%,
- Mining – 25%,
- Construction – 5-10%,
- Trade – 7-8%.
Sales profitability analysis
The formula for profitability of sales on the balance sheet allows the administration of the enterprise to find out the degree of efficiency of the organization in the use of costs in the process of making a profit.
A cost-benefit analysis is needed in the following cases:
- Receipt and increase in profits;
- Control of company development;
- Conducting comparisons with competitors;
- Detection of profitable and unprofitable products, etc.
Examples of problem solving
EXAMPLE 1
| Exercise | The company has the following indicators taken from the accounting documentation: Revenue (line 2110) 2014 – 206,000 thousand rubles. 2015 – 46,600 thousand rubles. 2016 – 105,500 thousand rubles. Net profit (line 2400) 2014 – 11,000 thousand rubles. 2015 – 3,000 thousand rubles. 2016 – 3,300 thousand rubles. Find the profitability of sales on the balance sheet. |
| Solution | Net profit margin formula: ROS=p.2400/p. 2110 * 100% ROS 2014 =11,000 / 206,000 * 100% = 5.34% ROS 2015 =3,000 / 46,600 * 100% = 6.44% ROS 2016 = 3,300 / 105,500 * 100% = 3.13% Conclusion. We see that the return on sales in 2015 increased to 6% compared to 2014, but comparing 2015 and 2016, we see that it fell to 3%. At the same time, profitability is above zero, which indicates a positive result. |
| Answer | ROS 2014 = 5.34%, ROS 2015 =6.44%, ROS 2016 = 3.13% |
EXAMPLE 2
| Exercise | Calculate the return on sales indicator and draw conclusions about its changes using the example of the Rusneft LLC enterprise. The following indicators are given from the accounting documentation: Total sales revenue (line 2110) |
In the activities of an enterprise, profitability is one of the most important indicators; it reflects the economic efficiency of its work over a certain period of time and is calculated to present a real picture of the business to the founders of the project, to make the enterprise attractive to investors (for example, when planning new directions of the project), to instill confidence in reliability to creditors. A formula that is well known to economists helps determine the profitability of sales, but a general understanding of this is necessary for the head of the company and those who plan to invest their funds in it.
General concept of profitability indicator and its components
First you need to find out what profitability is and on the basis of what indicators it is determined. In essence, this concept is understood as the efficiency of using funds or resources invested in an enterprise. This term came to us from the German language, in which “rentabel” means “profitable”. To express it, a percentage ratio or a profitability ratio in physical terms can be chosen.
If they talk about the profitability of sales and the enterprise as a whole, then they mean this indicator for all its resources. In the economic analysis of the project, in addition to the main turnover, the profitability indicator in relation to production, services, capital is considered, the profitability of personnel is taken, and there is also such a basic concept as return on assets.
A special indicator that is calculated to analyze economic activity is the profitability threshold. It is understood as that income from the sale of products that is able to fully cover the costs of the enterprise, but does not bring profit from the activity.
Sales profitability, calculation formula and features
The return on sales ratio shows how much each invested ruble brings income to the owner, in other words, it is an indicator of the share of profit in the volume of products or goods sold.
This ratio is somewhat different from other main indicators in that it does not reflect the profit of the enterprise, but exclusively the profitability of the sales process. It is calculated using a special formula in order to show the difference between the sales price and the costs that were made to purchase goods, produce or provide services.
An important feature is that the return on sales ratio does not take into account the amount of working capital or fixed capital that was necessary to obtain a given amount of profit. This feature allows you to compare the return on sales ratios of companies with different turnover of fixed assets and, based on the data obtained, analyze the effectiveness of this particular project.
The formula for calculating the profitability threshold can be represented in several ways. Most often, calculations are carried out using the formula through gross profit:
where: Pv – gross profit, B – revenue.
Gross profit is the difference between revenue and the full cost of goods (products, services).
Net return on sales is calculated using the formula:
RP (net) = IF/V,
where: Pch – net profit, B – revenue.
Net profit is the difference between revenue and the sum of all taxes, expenses and the full cost of goods (products, services), and revenue should also be exempt from VAT, excise taxes and other mandatory deductions.
According to some experts, the use of the second version of the formula, i.e. in which the profitability ratio is calculated based on net profit, makes the calculation more generalized and somewhat loses the essence of determining profitability specifically from the sales process and the calculated profitability threshold will give some inaccuracy. However, in practice this formula has found wide application.
Often we need return on sales ratios as a percentage; in these cases, the formulas will look like this:
RP = Pv/V*100%
RP pure = IF/V*100%
By calculating this sales indicator in several separate periods using the presented formulas, you can see the dynamics, which will allow you to determine the rationality of new projects and the expenditure of funds on them.
What is a “threshold” and the formula for calculating it
The profitability threshold is one of the most necessary indicators in economic analysis, which reflects whether the level of sales has fully covered the costs incurred for the purchase of goods, production of products or provision of services. Its components are the quantity of goods sold and the income received. The profitability threshold is otherwise called the “break-even point”, i.e. that limit that does not bring profit, but also does not cause damage from costs.
The costs that the profitability threshold entails are usually divided into:
- fixed costs - independent of the quantity of products produced);
- variable costs - with an increase in production volume, they increase proportionally to it.
For creditors, this indicator is especially important; it is calculated to confirm the sustainability of the enterprise.
- in monetary terms;
- in kind.
Profitability threshold (monetary) = revenue * fixed costs / (revenue - variable costs).
Profitability threshold (in kind) = fixed costs / (price of a unit of production - average costs per unit of production).

You can consider the application of the formula using an example. To do this, let’s assume that the company’s fixed costs are 400 thousand rubles, while it is calculated that the variable costs are 10 thousand rubles. for each unit of production and the price of the unit itself is 30 thousand rubles. Substituting the data into the formula, we find that the profitability threshold is: 400 / (30 – 10) = 20.
Therefore, 20 units of product must be produced and sold in order not to incur a loss. This figure shows the threshold for profitability in physical terms.
Neither the profitability ratio (sales, services, enterprise) nor the profitability threshold have clear standards for values; everything completely depends on the specifics of the activity.
Components of the overall profitability of an enterprise
For company founders and potential investors, an important issue is the overall profitability ratio. This indicator reflects the efficiency of the use of resources and property assets in the activities of the enterprise (meaning own funds and funds from circulation).
P = book profit / (average value of fixed assets + average value of turnover assets).
The formula shows the amount of balance sheet profit; it implies income received before tax. It is calculated as follows: expenses (commercial, administrative) are subtracted from the profit from product sales.
In addition, to conduct economic analysis and evaluate activities, different profitability ratios are used, these are: profitability of assets, production, sales and services, fixed capital, profitability of personnel. Only after analyzing each of them separately and as a whole can conclusions be drawn about the profitability and effectiveness of this activity.
 Return on assets is one of the economic indicators of core activity, which shows how much invested assets can increase profitability, in other words, how much profit each ruble invested in property brings in when implementing a business project. You can calculate return on assets using the formula: Return on assets = profit for a certain period / average assets.
It can be expressed both in quantitative terms and as a percentage.
When analyzing the activities of an enterprise, there is a division into return on assets:
- current assets - to calculate it, the amount of net profit must be divided by the average annual value of asset turnover;
- non-current - to calculate it, the formula uses the amount of net profit, which must be divided by the average annual value of non-current assets.
The next indicator is personnel profitability. This is also an important profitability ratio that affects the profitability of the enterprise and must be taken into account in financial analysis. It is calculated as the ratio of net profit to the number of employees. Like other ratios (sales, assets), personnel profitability is often expressed as a percentage.
 (1 ratings, on average: 5,00 out of 5)