Monopoly power and indicators of its measurement. Measuring Monopoly Power
Send your good work in the knowledge base is simple. Use the form below
Students, graduate students, young scientists who use the knowledge base in their studies and work will be very grateful to you.
Posted on http:// www. allbest. ru/
Posted on http:// www. allbest. ru/
Measuring a firm's monopoly power
Introduction
1. Monopoly power: concept, essence, sources and types
2. Characteristics of indicators for measuring the monopoly power of a company
Conclusion
Bibliography
Introduction
monopoly power economic closed
In the modern world, against the backdrop of the development of various markets, it is customary to talk about perfect competition as the only tool for achieving growth and prosperity.
However, perfect competition practically does not exist in any market. Therefore, the concept of monopoly should be highlighted.
In a perfectly competitive market, there are many buyers and sellers, so no single buyer or seller has a significant influence on the price. Most agricultural markets are close to perfectly competitive markets. For example, thousands of farmers grow wheat, which is bought by thousands of buyers.
As a result, no farmer or buyer can significantly influence the price of wheat.
Many other markets are competitive enough to be considered perfectly competitive markets. The global copper market, for example, has several dozen suppliers. This is enough that if one of the suppliers goes out of business, the impact on price would be negligible.
In addition to perfectly competitive markets, there are imperfectly competitive markets. Such (imperfect) competition can exist under conditions of monopoly, oligopoly, or monopsony. We will try to focus our attention on the concept of “monopoly” in our work.
The problems of monopolization of economic life and competition in commodity markets today attract the close attention of not only specialists, but also the general public.
The main purpose of this test is to study the measurement of a firm's monopoly power.
Main goals:
Define monopoly and monopoly power and identify its advantages and disadvantages.
Study indicators for measuring a firm's monopoly power.
1.Monopoly power: concept, essence, sources and types
Monopoly is a market structure in which one firm is the sole producer of a product for which there are no close substitutes. Let's consider the signs of a pure monopoly.
the only seller. A pure or absolute monopolist is an industry consisting of one firm that is the only producer of a given product or the only provider of a service; therefore, in this case the words “company” and “industry” are synonyms.
there are no close substitutes. A monopoly product is unique in the sense that there are no good or close substitutes. From a buyer's perspective, this means that there are no viable alternatives. The buyer is forced to purchase the product from the monopolist or go without it.
"price dictator" An individual firm operating under conditions of pure competition does not influence the price of a product, but “agrees with the price.” This is due to the insignificance of its share of the total supply. A pure monopolist, on the other hand, “dictates the price” because it controls the total supply of a given product. If necessary, he can change the price of the product by manipulating the quantity of the product offered.
blocked entry. A pure monopolist has no competitors by definition. The emergence of a monopoly is due to the existence of barriers to entry into the industry. Let's look at the existing barriers.
Effect of scale. Current technology in some industries is such that efficient, low-cost production can only be achieved if the producers are extremely large, both in absolute terms and relative to market share.
If a pure monopoly exists to begin with, it is easy to see why economies of scale would function as a barrier protecting that firm from competition. Newly created firms trying to enter this industry as small producers will have very little chance of survival and development. New firms - small producers - will not be able to produce at the same cost savings as the monopolist, and therefore will not be able to achieve the profits needed to survive and grow.
Another option is to “start when you're already big,” that is, to enter the industry as a large-scale producer. However, it is very difficult for a new business to find the funds to purchase the large amounts of capital equipment needed to achieve economies of scale across its entire production range. The financial barriers to the above option are in most cases so great that they seem to put a ban on this option. The scale of production explains why the desire to enter industries such as automobiles, aluminum and steel is extremely rare.
All of the above circumstances define a natural monopoly, which occurs when the scale of production is so large that a product or service can be produced by only one firm at a lower cost than if it were produced by two or more firms. In addition to pure and natural monopolies, there are also such types of monopolies as administrative, state, economic, closed and open. Initially, it should be noted that there are two types of natural monopolies.
natural monopolies. The birth of such monopolies occurs due to barriers to competition erected by nature itself. For example, a company whose geologists discovered a deposit of unique minerals and which bought the rights to the land plot where this deposit is located can become a monopolist. Now no one else will be able to use this deposit: the law protects the rights of the owner, even if he ultimately turns out to be a monopolist (which does not exclude regulatory intervention by the state in the activities of such a monopolist).
technical and economic monopolies. This can be conventionally called monopolies, the emergence of which is dictated by either technical or economic reasons associated with the manifestation of economies of scale.
Administrative monopoly
Administrative monopoly arises as a result of the actions of government bodies. On the one hand, this is the granting of individual firms the exclusive right to perform a certain type of activity. On the other hand, these are organizational structures for state-owned enterprises, when they are united and subordinate to different departments, ministries, and associations. Here, as a rule, enterprises of the same industry are grouped. They act on the market as one economic entity, and there is no competition between them. The economy of the former Soviet Union was one of the most monopolized in the world. It was the administrative monopoly that was dominant there, primarily the monopoly of all-powerful ministries and departments. Moreover, there was an absolute monopoly of the state on the organization and management of the economy, which was based on the dominant state ownership of the means of production.
State monopoly
The existence of state monopolies in the market for specific goods and services is caused both by the natural monopoly of individual state enterprises (for example, railway transport), and by state restrictions on the influx of new firms into any industry (for example, in the field of export-import operations of strategically important goods, etc.). d.).
Unlike a perfect competitor, who accepts the market price as given from the outside, the monopoly itself determines its prices based on the volume of market demand and the size of its costs. Market monopolization leads, as a rule, to a relative reduction in production volumes and higher market prices for goods and services sold by the monopoly. That is why in all developed countries of the world the state pursues a more or less strict policy of regulating the activities of monopolies, especially natural ones, and encouraging the forces of competition in the market.
Economic monopoly
Economic monopoly is the most common. Its appearance is due to economic reasons; it develops on the basis of the laws of economic development. We are talking about entrepreneurs who managed to gain a monopoly position in the market. There are two paths leading to it. The first is the successful development of the enterprise, constantly increasing its scale through the concentration of capital. The second (faster) is based on the processes of centralization of capital, that is, on the voluntary merger or absorption of bankrupt winners. In one way or another, or with the help of both, the enterprise reaches such a scale when it begins to dominate the market.
Our reasoning implies that monopolies' lower unit costs allow them to charge lower prices than if the industry were more competitive. But this may not happen. A pure monopoly can charge prices much higher than unit costs and make significant economic profits. For a pure monopoly, the cost advantage may materialize in the form of profits for the company rather than in lower prices for the consumer. For this reason, the government usually regulates the activities of natural monopolies by stipulating the price they can charge.
Open monopoly
A variant of an open monopoly is a situation in which the expansion of one firm turns it (at least for a certain time) into the sole supplier of a product. A firm achieves monopoly power without having special rights received from the state in the field of protection from competitors.
Closed monopoly
A closed monopoly occurs when a firm has special rights received from the state. It is protected by legal restrictions and prohibitions imposed by the state in relation to competitors.
A patent is the right to control the market for a product for a period of time, which is intended to protect the inventor from illegal hijacking of a product or technical process by competing enterprises who did not participate in the time, effort and money spent on its development. In addition, patents can provide the inventor with a monopoly position for the duration of their validity.
The development of patentable products is based on scientific research. Firms that achieve monopoly power through their own research and development activities or by purchasing the patents of other firms are in an advantageous position and strengthen their market position. The profits from one important patent can be used to fund the research and development activities needed to develop new patentable products. The monopoly power achieved through patents may well increase.
Ownership of resources
The institution of private property can be used as a means of creating an effective barrier to potential competitors. A firm that controls the raw materials that are needed in the production process can prevent the creation of competing firms.
Unfair competition
The firm's rivals can be eliminated, and the entry of new competitors can be blocked through aggressive, brutal actions. Common tactics include vilifying the product, pressuring input suppliers and banks to withhold materials and credit, poaching key personnel, and sharp price cuts designed to drive competitors into bankruptcy.
Now let's turn our attention to the main source of monopoly power - the elasticity of demand for the firm. There are three main factors that determine the elasticity of demand for a firm. First, the elasticity of market demand. A firm's own demand will be at least as elastic as market demand, and therefore the elasticity of market demand limits the potential for monopoly power. Secondly, the number of firms in the market. If there are many firms on it, and they do not differ much from each other in size, then it is unlikely that one of the firms will be able to significantly influence the price. Third, interaction between firms. Even if there are only two or three firms in the market, none of them will be able to increase the price many times over unless the competition between them is aggressive, with each firm trying to capture the lion's share of the market.
So, we come to the concept of monopoly power. Monopoly (market) power is the ability of a market subject to control market equilibrium parameters in its own interests. Its essence consists in the possession by a subject (group) of ownership of factors of production and exclusive rights that ensure a dominant position in a certain field (spheres) of activity, control over the market and dictate of its conditions, regulation of prices and production volumes, appropriation of monopoly profits and limitation of competition.
2. Characteristics of indicators for measuring the monopoly power of a company
Concentration measures are based on comparing the size of a firm with the size of the market in which it operates. The larger the size of the firm relative to the size of the overall market, the higher the concentration of the market.
The concentration index is the sum of the market shares of the largest firms operating in the market:
where Yi is the market share of the i-th company; k is the number of firms for which this indicator is calculated.
qi - company sales volume, Q - market sales volume
The concentration index measures the sum of the shares of the k largest firms in the industry (with k< n, n -- число фирм в отрасли). Рыночная доля измеряется в относительных долях (0 < Y < 1). При k = n очевидно Yi = 1. Для одного и того же числа крупнейших фирм чем больше степень концентрации, тем менее конкурентной является отрасль.
The concentration index does not tell us what the size of the firms that are not included in the k sample is, or the relative size of the firms in the sample. It characterizes only the sum of the shares of firms, but the gap between firms can be different.
The inadequacy of the concentration index to characterize the market power potential of firms is explained by the fact that it does not reflect the distribution of shares both within the group of largest firms and outside it - between outsider firms. Other concentration measures provide additional information about the distribution of the market among firms.
To measure the degree of inequality in the size of firms operating in the market, the dispersion of market shares indicator is used:
where Yi is the firm’s market share
The average market share of a firm is equal to;
n - number of firms in the market
Indicators of the dispersion of logarithms of market shares are also used
Both of these indicators have the same economic meaning - determining the uneven distribution of shares between market participants. The greater the uneven distribution of shares, the more concentrated the market, other things being equal.
However, dispersion does not characterize the relative size of firms: for a market with two firms of the same size and for a market with 100 firms of the same size, the dispersion in both cases will be the same and equal to zero, but the level of concentration will be different. Therefore, the dispersion indicator is used as an auxiliary tool.
The Herfindal-Hirshman index is defined as the sum of the squares of the shares of all firms. operating on the market:
The index takes values from 0 (in the ideal case of perfect competition, when there are infinitely many sellers in the market, there is only one firm producing 100% of output). If we count market shares as a percentage, the index will take values from 0 to 10,000. The higher the index value, the higher the concentration of sellers in the market.
Since 1982, the Herfindahl-Hirschman index has served as the main guideline for US antitrust policy. Its main advantage is the ability to react sensitively to the redistribution of shares between firms operating in the market. If the shares of all firms are the same, then HHI = 1/n.
The Herfindahl-Hirschman index provides information about the comparative ability of firms to influence the market under different market structures. The market power of a dominant firm in a competitive environment that controls 50% of the market is comparable to the market power of each of the four oligopolistic sellers. Likewise, on average, each of the duopolists that control the market will have approximately the same power to influence the market price as the dominant firm that controls 70% of the market.
The value of the Herfindahl--Hirschman index is directly related to the distribution of firms' shares in the market, so that:
An indicator of the dispersion of a company's market shares.
The above formula allows us to distinguish between the influence on the Herfindahl-Hirschman index of the number of firms in the market and the distribution of the market between them. If all firms in a market control the same share, the distribution is zero and the Herfindahl-Hirschman index is inversely proportional to the number of firms in the market. Given a constant number of firms in the market, the more their shares differ, the higher the index value.
The Herfindahl-Hirschman index, due to its sensitivity to changes in the market share of a firm, acquires the ability to indirectly indicate the amount of economic profit obtained as a result of the exercise of monopoly power.
Gini index
It is a statistical indicator based on the Lorenz curve.
Fig.1 Lorenz curve
The Lorenz curve, reflecting the uneven distribution of any attribute, for the case of concentration of sellers in the market, shows the relationship between the percentage of firms in the market and the market share, calculated cumulatively, from the smallest to the largest firms.
In the example of industry market A we used above, the Lorenz curve will look like shown in Fig.
The Gini index is the ratio of the area bounded by the actual Lorenz curve and the Lorenz curve for an absolutely uniform distribution of market shares (the so-called “absolute equality curve”) to the area of the triangle bounded by the Lorenz curve for an absolutely uniform distribution of shares and the abscissa and ordinate axes.
The Gini index represents a statistical indicator of the form:
Yi - production volume of the i-th company
Yj - production volume of the j-th company
n - total number of firms
The higher the Gini index, the higher the uneven distribution of market shares between sellers, and therefore, other things being equal, the higher the concentration in the market,
When using the Gini index to characterize seller concentration, there are two important points to consider. The first relates to a conceptual flaw in the index. It characterizes, like the dispersion indicator of logarithms of shares, the level of uneven distribution of market shares. Therefore, for a hypothetical competitive market, where 10,000 firms divide the market into 10,000 equal shares, and for a duopoly market, where two firms divide the market in half, the Gini index will be the same. The second point is related to the complexity of calculating the Gini index: to determine it, you need to know the shares of all firms in the industry, including the smallest ones.
Most measures of monopoly power explicitly or implicitly measure either the amount of economic profit or the difference between price and marginal cost. To assess the behavior of a company in the market and the type of market structure, the following indicators are used:
* rate of economic profit (Bain coefficient),
*Lerner coefficient,
*Tobin's coefficient (qTobin),
*Papandreou coefficient
Bain coefficient (index)
The Bain ratio shows economic profit per dollar of equity capital invested.
Accounting profit
Normal profit
In conditions of competition in the product market and an efficient financial market, the rate of economic profit should be the same (zero) for different types of assets. If the rate of return in any market (for any asset) exceeds the competitive rate, then this type of investment is preferable, or the market is not freely competitive: there are reasons why the additional return on investment does not equalize over the long term, and this implies that such a firm has a certain market power.
Lerner index
The Lerner index (coefficient) as an indicator of the degree of market competitiveness allows you to avoid the difficulties associated with calculating the rate of return. We know that under profit maximization, price and marginal cost are related to each other through the price elasticity of demand. The monopolist charges a price that exceeds marginal cost by an amount inversely proportional to the elasticity of demand. If demand is extremely elastic, then price will be close to marginal cost, and therefore a monopolized market will be similar to a perfectly competitive market. Based on this position, A. Lerner proposed in 1934 an index defining monopoly power:
The Lerner index takes values from zero (in a perfectly competitive market) to one (for a pure monopoly with zero marginal costs). The higher the index value, the higher the monopoly power and the further the market is from the ideal state of perfect competition.
The difficulty in calculating the Lerner index is due to the fact that information on marginal costs is quite difficult to obtain. Empirical studies often use this formula to determine marginal cost based on average variable cost data.
Tobin's coefficient (Tobin's q)
Tobin's Q relates a firm's market value (as measured by the market price of its shares) to the replacement cost of its assets:
P is the market value of the firm's assets (usually determined by the stock price)
C is the replacement cost of the company's assets, equal to the amount of expenses necessary to acquire the company's assets at current prices.
If the valuation of a company's assets by the stock market exceeds their replacement cost (Tobin's coefficient value is greater than 1), this can be regarded as evidence of received or expected positive economic profit. The use of the Tobin index as information about the position of the company is based on the hypothesis of an efficient financial market. The advantage of using this indicator is that it avoids the problem of estimating the rate of return and marginal cost for the industry.
Numerous studies have found that the coefficient q is on average quite stable over time, and firms with a high value usually have unique factors of production or produce unique goods, that is, these firms are characterized by the presence of monopoly rent. Firms with small values of q operate in competitive or regulated industries.
Papandreou coefficient (index)
Papandreou's monopoly power coefficient is based on the concept of cross elasticity of residual demand for a firm's product. A necessary condition for the exercise of monopoly power is the low influence of seller prices on the company's sales volume in interrelated markets or segments of the same market.
However, the indicator of cross elasticity of residual demand itself cannot serve as an indicator of monopoly power, since its value depends on two factors that have opposite effects on monopoly power: the number of firms in the market and the level of substitutability of the goods of the seller in question and the goods of other firms. An increase in the number of firms in the market leads to a decrease in their interdependence and a corresponding decrease in the cross-elasticity of residual demand.
In a perfectly competitive market, the elasticity of residual demand for a firm's product tends to zero. A decrease in the interchangeability of the firm's goods and the goods of other sellers as a result of deepening product differentiation leads to a decrease in the elasticity of residual demand. But in the same way is the departure of large sellers from the market where the company we are considering operates. will lead to a decrease in its dependence on the pricing decisions of other firms, to a decrease in the elasticity of residual demand. By the definition of a pure monopoly, a firm should not have close substitutes; therefore, for a monopoly, the elasticity of residual demand (coinciding with market demand) will also tend to zero.
In addition, the impact of the pricing policies of other firms in the market on the sales volume of the company in question depends on the limited capacity of other firms, on how much they can actually increase the volume of their own sales and thereby reduce the market share of our company.
To overcome this problem, Papandreou in 1949 proposed the so-called penetration coefficient, which shows by how many percent a company's sales volume will change if a competitor's price changes by one percent. The formula for the penetration coefficient (an indicator of Papandreou's monopoly power) looks like this:
Qdi is the volume of demand for a product of a firm with monopoly power
Pj - competitor's price
Competitors' capacity constraint ratio, measured as the ratio of the potential increase in output to the increase in demand for their product caused by a decrease in price. It varies from zero to one.
The Papandreou index is practically not used in applied research, but it very interestingly reflects two facets of monopoly power: the presence of substitute goods on the market and the limited power of competitors (or the possibility of their penetration into the industry). Expression
reflects the cross elasticity of demand for a firm's product. Its value indicates the possibility of switching consumer demand to competitors’ goods. The multiplier, in turn, characterizes the ability of competitors to take advantage of the increase in demand for their products. The lower any of the factors, the higher the monopoly power of the firm.
Thus, we see that market structure is a more complex concept than it seems at first glance. The market structure has many facets, which is reflected in its various indicators. We looked at indicators of the concentration of sellers in the market and discussed their main properties. The concentration of sellers in a market is extremely important in determining market structure. However, the concentration of sellers in itself does not determine the level of monopoly power - the ability to influence the price. Only with sufficiently high barriers to entry into the industry can the concentration of sellers be realized in monopoly power - the ability to set a price that ensures a sufficiently high economic profit. We have characterized the main types of barriers to entry into the industry, mainly non-strategic barriers that do not depend on the conscious actions of firms.
We examined the main indicators that allow us to characterize the level of monopoly power in markets and the problems associated with their measurement.
Conclusion
Market power in general is the ability of sellers or buyers to influence the price of a product. Market power comes in two forms. When sellers charge a price that is above marginal cost, we say that they have monopoly power, and we define monopoly power by the amount by which the price exceeds marginal cost. When buyers can obtain a price that is below their marginal valuation of a good, we say that they have monopsony power, and its amount is determined by the amount by which the marginal valuation exceeds the price.
Part of monopoly power is determined by the number of firms competing in the market. If there is only one firm (pure monopoly), monopoly power depends entirely on the elasticity of market demand. The lower the elasticity of demand, the more monopoly power the firm has. When there are multiple firms in a market, monopoly power also depends on how the firms interact. The more aggressively they compete, the less monopoly power each has.
Market power can impose costs on society. Monopoly power may be the reason that production is below competitive levels and therefore consumer surplus and producer surplus may be a total net loss.
Sometimes economies of scale make a pure monopoly desirable. But in order to maximize social welfare, the government needs to set and regulate prices.
It should be noted that the concept of “monopoly” is used not only in its strict meaning - as a pure monopoly, but is often used in a broad interpretation. In the latter case, monopoly is interpreted somewhat vaguely, as the dominant position of an economic entity in the market, that is, it can be assumed that in this version the concept of “monopoly” includes both pure monopoly and oligopoly.
The issue of limiting or even eliminating competition is a concern in many countries. The main role in its solution is given to the state; the market itself, as past and contemporary experience shows, is not sufficiently capable of protecting competition.
A decisive role in creating a favorable competitive environment in the market is played by antimonopoly legislation and the activities of antimonopoly authorities, the correct behavior of which contributes to the stabilization of the entire economy as a whole.
Bibliography
1.Makkonekel, K.R., Economics: principles, problems and politics: textbook / K.R. McConekel, S.L. Bru - M, Republic, 2010 - 785 p.
2.Barr, R Political Economy: In 2vol. from fr. T1/ R. Barr - M, International Relations, 2011 - 608p.
3.Tirol, J., Markets and market power: the theory of industrial organization: V 2T: trans. from English T2/ J. Tirol, Open Community Institute. Ed. V.M. Galperina, N.A. Zenkovich - 2nd ed., revised. - St. Petersburg: Economic School, 2010 -451 p.
4. Avdasheva, S.B., Theory of organization of industry markets: Textbook / S.B. Avdasheva, N.M. Rozanova: Institute "Open Community" - M, Master 2008 -
5. Pindyke, R., Microeconomics: [Textbook for economic universities and faculties] Trans. from English / R. Pindyke, D.L. Rabinfeld 5th international edition - St. Petersburg, Peter, 2012 - 606 p.
6. Gordeev, V.A., Two trends in the evolution of competition / V.A. Gordeev // World economy and international relations - 2012- No. 1- p. 42-48
7.Borushko, E.P., Concentration in commodity markets: state, indicators, measurements, government regulation/ E.P. Borushko, L.Yu. Dankovtseva//Economic bulletin NIEI-2011-No.1-p. 34-40
8. Volkonsky, V.A., On the role of monopoly in the modern economy / V.A. Volkonsky, G.I. Koryagin - Banking - M, 2012 - 174 p.
9. Sanko, G.G., Monopoly and antimonopoly regulation / G.G. Sanko - Mn. BSEU, 2010 - 95 p.
10. Bondar, V.A., Vorobyova, V.A., Microeconomics: textbook. allowance / A.V. Bondar, N.N. Sukharev; edited by A.V. Bondar, V.A. Vorobyov. - Minsk: BSEU, 2007. - 415 p.
Posted on Allbest.ru
...Similar documents
Monopoly as a type of imperfect competition. Economic sources of monopoly power and existing types of monopolies. Buyer segmentation factors. Analysis of firm behavior under monopoly conditions. Equilibrium of a monopolist firm, its average profit.
course work, added 06/10/2014
The essence of monopoly power and the characteristics of its manifestation. The consequences of monopolistic activity and its costs for society. Features of the formation of monopoly power in the Russian Federation. Antimonopoly orientation of the restructuring of the Russian economy.
course work, added 09.29.2012
Disclosure of the economic essence of a monopoly as a system of exclusive rights to production, trade and other economic activities. The procedure for setting prices and production volumes under conditions of a pure monopoly. General indicators of monopoly power.
test, added 08/06/2014
Characteristic features of a monopoly. Forms and types of monopolies. Types of monopolies. Monopoly power. Sources of monopoly power. Non-price factors influencing market demand. Natural monopoly. Administrative and state monopolies.
abstract, added 05/03/2007
Definition of the concept and role of economic competition in a modern market economy. Characteristics of types of economic competition. Analysis of the price and production schedule of a firm under monopolistic competition that maximizes profits.
course work, added 12/17/2017
Characteristics of the modern market of monopolistic competition. Equilibrium of a monopolistic competitor in the short and long run. Costs of monopolistic competition. The main features of the structure of monopolistic competition.
abstract, added 07/09/2015
History of consideration of the issue of monopolies. Monopolies and the social price of their power. Essence, forms and types of monopolies. Behavior of a firm that is a monopolist in the market. State influence. The dynamics of the formation of monopolism in modern Russia.
course work, added 06/03/2007
The essence and concept of monopoly. Factors that determine the price elasticity of demand. Indicators and sources of formation of monopoly power. Its types and features of manifestation in the Russian economy. Socio-economic consequences of monopolization of power.
course work, added 07/20/2013
Characteristics of market models and economic policy. Competition as the basis of a market economy. Market models of imperfect competition. The essence of monopoly, indicators, sources and economic consequences of monopoly power (using the example of JSC Russian Railways).
course work, added 09/15/2014
The essence of monopoly, the history of their origin, forms and types, profit maximization. Sources of monopoly power. Interaction between firms. The monopoly makes decisions on the volume of production and the price of goods. State policy regarding monopolies.
thereby obtaining additional profit, this means that this company has monopoly power; monopolists, oligopolists and monopolistic competitors have it. A way to measure monopoly power is the amount by which the profit-maximizing price exceeds marginal cost (as a share of the price). This method of determining monopoly power (part of the rule of thumb) was proposed in 1934 by the American economist Abba Lerner and was called Lerner's indicator of monopoly power , or Lerner coefficient :
The value of the Lerner coefficient ranges from zero to one, i.e. the higher it is, the more monopoly power the firm has. The Lerner coefficient can also be expressed through the coefficient of price elasticity of demand, i.e.
It is important to remember that greater monopoly power does not guarantee high profits. Small grocery stores operating at night have more monopoly power than supermarkets, but they make less profit because sales volume is much lower and average fixed costs are higher than those of supermarkets.
What are the sources of monopoly power? Ultimately, the reason for monopoly power is the elasticity of demand for the firm ( L = -/E d). Why do some firms have a more elastic demand curve while others have a less elastic one? What determines the elasticity of demand for a firm?
The main sources of monopoly power include:
- 1. Elasticity of market demand. The monopolist's demand curve coincides with the market demand curve. Then the firm's elasticity of demand and the elasticity of market demand will coincide. In the case where there are several firms in the industry, the elasticity of market demand sets a lower limit for the elasticity of each firm, i.e., the price elasticity of demand for any firm in the industry cannot be less than the elasticity of market demand.
- 2. Number of firms in the market. The monopoly power of each firm in an industry decreases as the number of firms in the market increases (all other things being equal). After all, the more competitors there are, the more elastic the company’s demand will be, i.e., if the price increases, you can quickly lose customers.
- 3. Interaction between firms
:
- in the case of aggressive price competition, firms have minimal monopoly power. The demand for their products is very elastic: any increase in price will lead to the loss of customers;
- in the case of collusion, which in many countries is considered a violation of antitrust laws, the elasticity of demand may be low, and then firms will have more monopoly power.
Monopoly power is known to promote inefficient resource allocation. Replacing competition with a monopoly leads to an increase in prices and a reduction in output, resulting in social costs, i.e., the monopoly equilibrium is not effective from the point of view of society. However, in some cases where a monopoly is natural, it will be the only effective one.
The simple monopoly model discussed above can be expanded. We assumed that the monopolist would sell all units of production at the same prices. But monopolies can set different prices for different categories of buyers, i.e., carry out price discrimination. For example, museums set low admission prices for schoolchildren, students and pensioners (their demand is more elastic than that of other visitors) and very high prices for foreigners (their demand is completely inelastic). An example of price discrimination can be the setting of a high price for the first screenings of a film and its subsequent reduction when the film enters mass distribution. Various forms of price discrimination are often used by firms to increase profits.
In this chapter, we found out what market structures are, what perfect competition is and its opposite - monopoly and monopsony. Now we know how, under conditions of perfect competition and monopoly, the optimal volume of production that maximizes profit is determined, and how the activities of these firms differ in the short and long term. At the same time, we examined such categories as the firm’s gross income, its average and marginal income, and also formulated the rule for maximizing profit for all market structures. We also learned what the rule of thumb is for pricing, what monopoly power is and how to measure it, and what the main sources of monopoly power are.
The word monopoly comes from two Greek words (monos - one, poleo - sell), meaning “sole seller”. A monopoly is a large economic entity that has certain economic advantages and dominates the industry market.
Historically, monopoly was initially defined as a legal concept. It first appeared in Roman law, where such features as possession of power, exclusive rights, and an advantage allowing for excess profits were highlighted. Currently, monopoly is characterized as a legal concept, a market model and as a form of production organization. In Western economic theory, the first two types of definitions predominate, i.e. monopoly is presented as one of the main market models. In this case, the concept of “pure monopoly” is used, which is defined as a firm that is the only producer of a product that does not have close substitutes (substitutes), or as an industry in which a small number of firms control all or most of its production, or as the only seller of a product, having the ability to influence the price by controlling the availability (supply) of goods.
A perfect monopoly is a fairly rare phenomenon. It requires the following conditions to be met:
- 1. One seller is opposed by a large number of buyers. In other words, monopoly means the loss of economic equality between producer and buyer. A type of market in which there is only one buyer is called a monopsony.
- 2. Lack of perfect substitutes. The buyer is forced to either buy this product from the monopolist or do without it.
- 3. Lack of freedom to enter the market (industry).
A monopoly can exist only because entry into the market seems unprofitable or impossible for other enterprises. Barriers to entry are many and varied. Among them:
- · economies of scale - occur when in some industries (steel production, automotive industry, etc.) the existing technology is such that it is possible to achieve minimum costs in the long run only with a large volume of production, both in absolute terms and relative to market share. Small firms that try to enter such an industry will not be able to make a profit and stay in the industry due to the fact that they do not have the ability to realize economies of scale and produce products at lower or the same costs as a monopolist;
- · financial barriers mean that in some industries large capital investments are required in order to produce efficiently. It is quite difficult to find financial resources for these purposes;
- · patents - in the legislation of many countries, including Belarus, legal protection is provided for an invention for a certain time. Also, a large company has the opportunity to finance its own research and development activities or buy patents from other companies;
- · the existence of government licenses, quotas or high duties on the import of goods. Restriction as a result of the supply of goods leads to monopolization of the industry (for example, the production of medical drugs);
- · control by the monopolist of sources of necessary raw materials or other specialized resources;
- · high transport costs, which contribute to the formation of isolated local markets, so that a technologically unified industry can represent many local monopolists.
In addition, the monopolist enterprise itself may pursue a pricing policy that makes entry into the market unattractive for potential competitors.
4. The ability to simultaneously influence the price and quantity of products supplied. However, in reality this rarely happens. The degree of influence of a monopolist on the market price is very high, but not unlimited, since any company, including a monopoly, faces the problem of limited market demand and a reduction in sales volume is directly proportional to the rise in prices. That is, the main limiting force of the market power of a monopoly is the elasticity of demand for its products. If the seller has set the price, then market demand dictates the volume of production.
Thus, monopoly power can be defined as the ability of a producer to control the market price of his product and influence it by regulating the quantity supplied to the market. As a result, the monopoly position is a kind of factor of production for the monopolist, a source of income. At the same time, market power can only be wielded to a certain extent, since its long-term preservation requires certain conditions that will limit the access of competing firms. It should be noted that the concepts of “monopoly”, “market” and “economic” power are often used as synonyms (R. Pindyck, D. Rubinfeld, S. Fischer, L. Erhard, etc.).
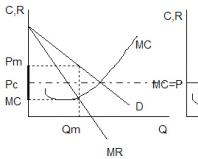
Monopoly power has the following features: a) an increase in demand is not necessarily accompanied by an increase in the quantity of goods supplied. A monopoly often simply raises the price. The decisive factor determining the quantity supplied of a good is the change in the marginal revenue curve, not the demand curve; b) for a monopolist it is impossible to determine the demand curve, since a given quantity of goods offered by a monopoly can be sold at different prices depending on demand and its price elasticity.
Monopoly power can only be enjoyed to a certain extent. Factors contributing to the strengthening or weakening of monopoly power are: the economic potential of the company, expected profits, the scale of innovation, the presence of trade secrets, high barriers to the emergence of competitors, including protectionist government policies. The presence of substitute goods, competition from firms producing similar products, and potential competition from companies that have the opportunity to organize similar production, imperfect market information, crises, wars, violence. Thus, the pressure of potential competition significantly limits market power.
So, monopoly power is the ability of a subject to influence the situation that has developed in a certain market, bringing benefit to itself. The bearers of monopoly power can be the state, enterprises, and individual individuals. Both large firms and small ones that have certain advantages can have monopoly power.
Modern economic theory does not have a clear classification of types of monopoly, but proposes to distinguish between pure or absolute, natural and artificial, production and organizational, closed and open, simple. A pure monopoly is represented by a firm or industry that is the sole producer of a product that has no substitutes and determines production volumes and prices. The company's market share is usually 100%. There are usually three main types of pure monopoly: natural, open, and closed monopolies. The existence of these types of monopoly presupposes the presence of various types of circumstances due to which one company can become the only supplier of products on the market. A natural monopoly is interpreted as a single firm or industry serving the entire market due to the inefficiency of disaggregation and due to the minimization of production costs due to economies of scale or ownership of unique natural resources. For example, the natural monopoly of the Republic of Belarus includes the transportation of oil and gas through pipelines. As a type of natural monopoly, a production (technological) monopoly is an enterprise (association) that controls the production and sale of certain products, the specificity of the production technology of which determines the large size and the presence of close technological interconnection of the enterprises included in the association. Artificial monopolies include monopolies created by the state for the purpose of concentration and specialization of production. An organizational monopoly acts as an association of enterprises and organizations of the same profile. It occurs at a high level of concentration of production and is associated with the existence of sectoral ministries. This is nothing more than an artificial monopoly, meaning centralized management of any sphere of production. An open monopoly is a monopoly in which one firm (at least for a while) becomes the sole supplier of a unique product, but has no special protection from competition. Companies that enter the market with new products for the first time often find themselves in situations of open monopoly. Innovative activity forms the basis for the functioning of such firms. Closed monopoly - a monopoly protected by legal restrictions imposed on competition. Such monopolies include enterprises that have exclusive rights received from the state to supply any product to the market. Entire industries (for example, manufacturers of domestic cars) may find themselves in a situation of closed monopoly, protected from imported products by high customs duties. Other options for the emergence of a closed monopoly include patent protection and the institution of copyright. A simple monopoly is a monopoly that sells its products at the same price to all buyers at any given time.
If we consider a sufficiently long period, then many monopolies become open because:
- · legal prohibitions as barriers to competition can be abolished;
- · the cost advantages of natural monopolies may be offset by significant changes in technology;
- · all monopolies experience the blows of competition from substitute goods.
Historically, there have been three main forms of monopolistic alliances: cartels, syndicates and trusts. A cartel is the unification of a number of enterprises in the same industry, preserving their production and commercial independence, but providing for the establishment of uniform monopoly high prices for products sold, delimitation of sales markets, etc. A syndicate is the unification of a number of enterprises in the same industry with the elimination of the commercial independence of these enterprises. The syndicate sells the products of the merged enterprises through its sales offices. The trust provides for the consolidation of the property of enterprises in one or several industries with the complete elimination of their production and commercial independence.
For a perfectly competitive enterprise the price equal to marginal cost, and for an enterprise with market power, the price higher marginal costs. Hence, the amount by which price exceeds marginal cost(), can serve as a measure of monopoly (market) power. The Lerner index is used to measure the deviation of price from marginal costs.
Lerner index: two ways of counting
The indicator of monopoly power, the Lerner index, is calculated using the formula:
- P—monopoly price;
- MC is marginal cost.
Since when the ability of an individual firm to influence prices is zero (P = MC), the relative excess of prices over characterizes the presence of a particular firm market power.

For a pure monopoly in a hypothetical model, the Lerner coefficient is equal to the maximum value L=1. The higher the value of this indicator, the higher the level of monopoly power.
This coefficient can also be expressed in terms of the elasticity coefficient using the universal pricing equation:
(P-MC)/P=-1/Ed.
We get the equation:
L=-1/Ed,
where Ed is the price elasticity of demand for the company's products.
For example, with elasticity of demand E = -5, the coefficient of monopoly power is L = 0.2. Let us emphasize once again that high monopoly power in the market does not guarantee a company high economic profit. Firm A may have more monopoly power than the firm B, but earn less profit if it has higher average total costs.
Sources of monopoly power
The sources of monopoly power of any imperfect competitor, as follows from the formula derived above, are associated with factors that determine the elasticity of demand for the firm's products. These include:
1. Market elasticity(industry) demand for the company's products (in the case of a pure monopoly, market demand and demand for the company's products coincide). The firm's elasticity of demand is usually greater than or equal to the elasticity of market demand.
Let us recall that among the main factors determining elasticity demand by price, distinguish:
- the presence and accessibility of substitute goods on the market (the more substitutes, the higher the elasticity; with a pure monopoly there are no perfect substitutes for a product, and the risk of a decrease in demand due to the appearance of its analogues is minimal);
- time factor (market demand, as a rule, is more elastic in the long term and less elastic in the short term. This is due to the time lag of the consumer’s reaction to price changes and the high probability of substitute goods appearing over time);
- the share of spending on a product in the consumer budget (the higher the level of spending on a product relative to the consumer’s income, the higher the price elasticity of demand);
- the degree of market saturation with the product in question (if the market is saturated with any product, then the elasticity will be rather low, and vice versa, if the market is unsaturated, then a decrease in prices can cause a significant increase in demand, i.e. the market will be elastic);
- variety of possibilities for using a given product (the more different areas of use a product has, the more elastic the demand for it. This is due to the fact that an increase in price reduces, and a reduction in price expands the scope of economically justified use of a given product. This explains the fact that the demand for universal equipment is, as a rule, more elastic than demand for specialized devices);
- the importance of the product for the consumer (essential goods (toothpaste, soap, hairdresser services) are usually price inelastic; goods that are not so important for the consumer and the purchase of which can be postponed are characterized by greater elasticity).
2. Number of firms on the market. The fewer firms there are in the market, the greater, other things being equal, is the ability of an individual firm to influence prices. What matters is not just the total number of firms, but the number of the most influential ones with a significant market share, the so-called “major players.” Therefore, it is obvious that if two large companies account for 90% of sales, and the remaining 20 - 10%, then the two large companies have great monopoly power. This situation is called market (production) concentration.
3. Interaction between firms. The more closely firms interact with each other, the greater their monopoly power. Conversely, the more aggressively companies compete, the weaker their ability to influence market prices. An extreme case, a price war, can drive prices down to competitive levels. Under these conditions, an individual firm will be wary of raising its price to avoid losing its market share and will thus have minimal monopoly power.
Monopoly power- this is the ability of a company to influence the price of its product by changing the quantity of this product sold on the market.
The degree of monopoly power may vary. A pure monopolist has complete monopoly power because is the only supplier of unique products.
But a pure monopoly is rare, because Most products have close substitutes. At the same time, most firms control price to one degree or another, i.e. have some monopoly power. If there is one monopoly firm operating in the market, we speak of relative monopoly power.
A necessary prerequisite for monopoly power is a downward sloping demand curve for the firm's output.
So, a firm with monopoly power charges a price above marginal cost and earns additional profit, called monopoly profit. Monopoly profit is a form of realization of monopoly power.
The degree of monopoly power, oddly enough, can be measured. The following indicators of monopoly power are used:
1. Lerner's indicator of monopoly power:
The Lerner coefficient shows the extent to which the price of a product exceeds the marginal cost of its production. L takes values between 0 and 1. For perfect competition, this indicator is 0, because P = M.C.. The more L, the greater the monopoly power of the firm. It should be noted that monopoly power does not guarantee high profits, because the amount of profit is characterized by the ratio P And ATC .
2. If we multiply the numerator and denominator of the Lerner exponent by Q, we get a formula for calculating monopoly power index: , or . Thus, high profits in the long run are also seen as a sign of monopoly power.
3. Degree of market concentration, or Herfindahl-Hirschman index:
where Pi is the percentage market share of each firm, or the share of the firm in the market supply of the industry, n is the number of firms in the industry. The greater the firm's share of the industry, the greater the potential for a monopoly to emerge. If there is only one firm in the industry, then n =1, Pi =100%, then H = 10,000. 10,000 is the maximum value of the market concentration indicator. If H< 1000, то рынок считается неконцентрированным. Если Н? ≥ 1800, то отрасль считается высокомонополизированной. Нужно иметь в виду, что данный показатель не дает полной картины, если не учитывать удельный вес импортируемых товаров.
 (1 ratings, on average: 5,00 out of 5)