Changes in break-even point. What is the break-even point and its calculation
Andrey Mitskevich Ph.D. in Economics, Associate Professor at the Higher School of Financial Management of the Academy of Economics under the Government of the Russian Federation, head of the consulting bureau of the Institute of Economic Strategies
Break-even analysis
The company's management has to make various management decisions regarding, for example, the selling price of goods, planning sales volumes, opening new retail outlets, increasing or, conversely, saving on certain types of expenses. In order to understand and evaluate the consequences of decisions made, an analysis of the relationship between costs, volume and profit is necessary.
Break-even analysis shows what will happen to profit when production volume, price and basic cost parameters change. The English name for break-even analysis is CVP analysis (cost - volume - profit, that is, “costs - output - profit”) or Break - even - point (break point, break-even point in this case).
Who doesn't know this? However, only a few companies use classics in the life of companies. Why? Maybe “professorial economics” is so divorced from life? Let's try to understand what CVP analysis is and why its fate is ambiguous. At least in our country.
Assumptions made in CVP analysis
Break-even analysis is performed in the short term if the following conditions are met over a certain range of production volumes, called the acceptable range:
- costs and output are expressed as a first approximation as a linear relationship;
- productivity does not change within the limits of the changes in output being considered;
- prices remain stable;
- Finished goods inventories are insignificant.
Academician and our only compatriot - winner of the Nobel Prize in Economics for 1975 L.V. Kantorovich said: “mathematical economists begin all their work with “suppose that...”. So this cannot be assumed.” Perhaps, in our case, the professors stepped on the same rake?
The answer to this question is encouraging: working hypotheses, tested by practice
management accounting. If they are violated, it is not difficult to make changes to the model.
The acceptable range of production volumes (area of relevance) is determined by the hypothesis of linearity of costs. If the hypothesis is not in doubt, the range is accepted as the constraints of the CVP model. Basic classical relationships:
1. AVC ≈ const, i.e. average variable costs are relatively constant.
2. FC are unchanged, i.e. there is no threshold effect.
Then the total costs of producing the product are determined by the relation
TC = FC + VC = FC + a × Q, where Q is the volume of output.
The single-product problem lives in textbooks, while the multi-product problem lives in practice.
- Single-product problems answer questions from the area of break-even analysis in the form of the quantity of product produced ((2). Most often, CVP analysis in theory comes down to determining the classic break-even point, which shows how many units of product need to be produced to cover all fixed costs. How As a rule, it also applies to the target profit, i.e. it comes down to determining the volume of output that provides a given profit.
- Multi-product tasks provide answers to the same questions in the form of revenue (TK). At the same time, it is assumed that its structure remains unchanged, at least in the sense of a constant share of marginal profit in revenue.
Accounting methods affect the applicability of CVP analysis. Break-even analysis is carried out using Variable Costing, since Direct Costing and, especially, Absorption Costing give errors. If the company does not use at least Direct Costing, then there will be no break-even analysis, therefore one of the reasons for the unpopularity of CVP analysis in Russia: the dominance of Absorption Costing.
Break-even points
1) The classic break-even point for the number of units of production assumes the recoupment of total costs (TC = TK). The critical sales volume is the one at which the company has costs equal to the revenue from the sale of all products (i.e., where there is neither profit nor loss).
In the single-product version, the value of the break-even point (Q b) is directly derived from this ratio:
This formula dominates the literature and, in fact, therefore deserves the name of the classic break-even point (see Fig. 1).

Rice. 1. Classic CVP analysis of the behavior of costs, profits and sales volume
An example of calculating the classic break-even point by the number of units of production
The Corporation decides to open several mini-wholesale stores. Their characteristics:
- narrow specialization (office paper, mainly A4 format)
- small retail space (room up to 20 sq.m., or remote retail outlet);
- minimum sales staff (up to two people);
- The form of sales is predominantly small wholesale.
Table 1
- Marginal profit per unit of production: 224 -180 = 44 rubles. We calculate the critical point using the formula:
- Break-even point = Fixed costs / Contribution margin per unit
We get: 10000: 44 = 227.27.To reach the critical point, the store needs to sell 228 packs of paper within a month (10 packs per day), with six working days a week.
2) Multi-product break-even analysis. So far we have assumed that there is only one product, but in real life this is a minor special case. Paradoxically, the multi-product case is less popular in the literature and, even more so, in practice. The fact is that in this case the result of the break-even analysis is difficult to interpret. For a practitioner, it is vague because it gives hundreds of answer options instead of a clear guideline for assessment.
Let's look at the mathematics of this case. It is clear that revenue must cover total costs. In this case, we get not one break-even point, but a plane in N-dimensional space, where N is the number of types of products. If we make a fairly correct assumption, accepted in classical management accounting, about the constancy of AVC i = V i , we obtain a linear equation:
These points, according to the logic of reasoning, are very similar to the points of the marginal I break-even variable. Unfortunately, the remaining inseparable fixed costs cannot be distributed between products on one and balanced basis. If all products are “cash cows,” such a base could be the conditional marginal profit (revenue minus variable costs and minus own fixed costs for each product). But since output is unknown in the break-even point question, neither the conditional contribution margin nor the revenue work.
In the second step, you will have to distribute the remaining costs:
NFC = FC - ΣMFC i
Options:
a) equally, if there is no reason to prefer one product;
b) in proportion to planned revenue, if the sales plan has been drawn up. Naturally, only total fixed costs are shared;
c) if you have a plan, you can return to a balanced base (for example, marginal profit), but without part of the production
allocated to cover own costs (MRS i).
An example of calculating break-even points based on developed Direct Costing.
Let's say a company produces two types of products: “Alpha” and “Beta”, sold at prices of 9 and 20 thousand dollars per piece, respectively. Average variable costs (AVC) are planned at the level of 4 and 10 thousand dollars, respectively.
Individual fixed costs for Alpha were $2,000 thousand for the planned quarter, and for Beta - $8,000 thousand. The remaining fixed costs (NFC) turned out to be equal to $10,000 thousand.
a) when dividing undivided fixed costs equally (5000 per type of product), we get:
Let's try to determine break-even points using different options. First, we calculate the coverage of our own fixed costs:
b) when dividing proportionally to the plan, you need to know this plan: 2900 and 2175, for example, in pieces. As the distribution base, we take revenue minus coverage of our own fixed costs:
22500 thousand dollars = 2900 x 9 - 400 x 9 for Alpha;
27500 thousand dollars = 2175 x 20 - 800 x 20 for “Beta”.
c) the marginal profit base assumes that planned output is reduced by the amount of own coverage (in units):
2900 — 400 = 2500 2175 — 800 = 1375
Conclusion: the deviations in the calculations are small, so you can use any of the proposed methods in the case of approximately equal volumes of products. Otherwise, it is better to use methods B and C:
B - for growing markets and products;
B - for “cash cows”.


3) The classic break-even point for revenue is the most common approximate solution to a multi-product problem. It is assumed that the revenue structure changes insignificantly. The task is posed as follows: to find the value of revenue at which profit is reset to zero. To do this, the economist is required to have a coefficient ( To), showing the share of variable costs in revenue. It is not difficult to find, knowing the shares of variable costs in total costs and profit in revenue. As a result, we get the equation:
For example:
- share of variable costs in revenue = 9742/16800 = 58%;
- fixed costs = 5816 thousand rubles;
- break-even point = 5816 / (1-0.58) = 13848 thousand rubles of revenue
In contrast to the classic break-even point for the number of units of production, a reservation should be made regarding the accuracy of the results:
- formula (7) is certainly correct if the output structure remains unchanged;
- however, a less stringent condition can be formulated: the coefficient k remains unchanged, i.e. share of variable costs in revenue.
- Break-even point based on marginal ordering in descending order. The break-even point shifts to the left when using product ordering in descending order of contribution margin.
Let's look at this interesting and rarely described effect with an example. So, the company has fixed costs equal to $16,000 and produces 4 products with different shares of marginal profit in revenue (see Table 2).
Table 2. Initial data for calculating the break-even point based on marginal ordering
|
Product |
Revenue (TK) Doll. |
Marginal profit (/OT), dollars. |
Share of marginal profit in revenue |
|
Let's calculate the break-even point for revenue based on formula (7):

Let's determine it taking into account the fact that first we will produce the most profitable products: A and B. They are just enough to cover fixed costs: μπ(A)+μπ(B) = 12000 + 4000 = 16000 = FC. Thus, we obtain an optimistic estimate of the break-even point:
20000 + 8000 = 28000.
The break-even point based on the marginal ordering in ascending order gives a pessimistic estimate. To illustrate, we use the same example. Products D, C, B are only enough to cover $12,000, and the remaining fixed costs of $4,000 represent one third of the output of product A. That is, a pessimistic estimate of the break-even point:
Break-even points based on the marginal ordering in descending and ascending order together give the range of possible break-even points.
4) Point 1. LCC break-even. The Life Cycle Costing approach to the problem of costs and profits defines the break-even point as the output that pays back the full costs, taking into account the entire life of the product. The LCC approach encroaches on the prerogatives of investment design. In addition to fixed costs, he also insists on covering investment costs.
LCC Analysis Example
Let's say a consortium of Russian firms invested $500 million in research and development (R&D) for a new aircraft.
Fixed costs consist of $700 million in R&D (one-time expenses in a given year), as well as $50 million in annual fixed costs. Variable costs per aircraft are $10 million. It is expected that 25 aircraft will be produced per year, and they can be sold on the market for a maximum of 16 million dollars. How many aircraft must be sold to compensate for all costs without taking into account the time factor (this is also the break-even point, but taking into account what?) and how many years will it take?
Solution: Let's denote the unknown number of years as Y. Fixed costs will depend on the number of years to reach the break-even point: 700 + 50 x Y. Let's equate the total costs and revenue for Y years:
700 + 50 x Y + 25 x 10 x Y = 25 x 16 x Y.
Hence Y = 7 years, during which 175 aircraft will be produced and sold.
5) Marginal break-even point (the payback point for an additional unit of production). In modern complex production, marginal costs (for the production of an additional unit of product) do not immediately become lower than the price. Release,
ensuring break-even of an additional unit of production is determined by the ratio:
Q bm: P = MS(Q bm) (8)
This point shows the moment (output) when the company begins to work “in plus”, i.e. when, with the release of one more unit of production, profits begin to increase.
Unfortunately, there is no more detailed formula. This ratio
6) Break-even point of variable costs (variable cost coverage point):
TR = VC or P = AVC. (9)
It shows that the process of recoupment of fixed costs will soon begin. This is an important indicator both for managers who “launched” a new product and for owners. However, here too there is no more intelligible formula for calculations. The reason is the same: ratio
(9) always individually.
Target profit points
They show the output of a single product (or revenue in the case of multi-product production) that provides a given mass or rate of profit.
1. Target profit point by number of units of production.
The traditional indicator is output that provides a target profit. Similar calculations are performed in many companies. Suppose the required profit is π, that is
This formula is easily modified in the case of target after-tax profits. Here are simplified calculations. If the target after-tax profit should be equal to z, then (TR - TC) × (1 - t) = z, where t is the income tax rate. Therefore, (P - AVC) x Q x (1 - t) = z + FC × (1 - t) or
2. The target profit point for revenue is easily calculated by analogy with formula (7):
In the multi-product case, it is subject to the same restrictions on the invariability of the coefficient k, i.e. share of variable costs in revenue.
Sensitivity analysis is based on the use of the technique “what will happen if one or more factors affecting the value of sales, costs or profits change.” Based on the analysis, it is possible to obtain data on the final result for a given change in certain parameters. The sensitivity analysis is based on safety edges.
Safety margins (sometimes translated as safety margin or safety margin) show the margin of safety, break-even of a business in percentage or physical units, or in rubles of revenue. Presentation as a percentage is more clear and, most importantly, allows you to normalize this important indicator. Although these standards are extremely approximate, they are useful. Mathematicians speak about such figures and formulas with disdain: “managerial indicators.” But there is no escape from this “engineering approach”.
Classic safety edge by number of units:
It shows how much percent revenue can decrease if production is unprofitable. An indicator less than 30% is a sign of high risk.
Classic security edge by revenue:
Both of these security edges are good for the business as a whole, as fixed costs are clear, but are of little use for business segments. However, the “frontal” application of variables or marginal costs, as you remember, requires the nonlinearity of their functions. Classical management accounting does not study these functions and therefore is forced to consider them linear. Does this mean that there are no safety edges other than the classic ones? The answer will be no.
The price safety margin shows how much the price must be reduced so that the profit becomes zero. This will be at the critical price P k = AC. Then the safety margin will be as a percentage of the existing price:
The safety margin for variable costs shows how much specific variable costs need to be increased in order for the profit to go to zero. The critical value of AVC is achieved at AVC = P - AFC. Because
The safety margin for fixed costs in absolute terms is equal to profit, and in relative terms:
Please note that in formulas (15-17) the output remains unchanged.
Problems in determining break-even points
If a firm faces semi-fixed costs, there may be multiple break-even points. The break-even chart (see Fig. 2) shows three break-even points, and the profit and loss zones replace each other as the volume of activity increases.

Rice. 2. Multiplicity of classical break-even points in the case of semi-fixed costs.
Similar multiplication also applies to non-classical break-even points.
Difficulties in conducting a break-even analysis may be due to the following reasons:
- if supply is high, the unit price may have to be reduced. Consequently, a new break-even point will appear, lying to the right;
- “large” customers will likely be eligible for volume discounts. The break-even point moves to the right again;
- If demand exceeds supply, then it may be advisable to increase the price. This will move the break-even point to the left;
- the cost of raw materials and materials per unit of production may decrease with large volumes of purchases or increase with supply interruptions;
- unit wage costs for production workers are likely to decrease with high production volumes;
- both fixed and variable costs tend to increase over time;
- costs cannot always be accurately divided into fixed and variable;
- the sales structure may change quite significantly.
Primitive business plans simply ignore all these elementary analytical calculations.
However, it is believed that break-even analysis is carried out everywhere and its importance is great. My observations do not confirm this. Like any model, CVP has its own “battlefield”, and it is fragmented. Many companies conduct CVP analysis only for new projects. Regular work with the profitability of products and segments in our country, unfortunately, is not yet enough.
Case with solutions
So, two companies: ZAO Staromekhanicheskiy Zavod (hereinafter referred to as SMZ) and OAO Foreign Automation (hereinafter referred to as ZAM) operate in the Little Russian market and produce parts used in car repairs. Today these two companies have divided the Russian market - each holds 50%. The manufactured parts have the same quality and price. The production facilities of both companies are located in the vicinity of Mariupol.
However, companies differ radically in their cost structures. "Foreign Automation" has a fully automated and very capital-intensive production. And the “Old Mechanical Plant” is a non-automated production with a large share of manual labor. The companies' monthly profit and loss statements are as follows (see Table 1).
Table 1. Initial situation (in monetary units)
|
Indicators |
"Foreign Automation" |
"Old Mechanical Plant" |
|
Sales, pcs. | ||
|
Price for one | ||
|
Unit variable costs | ||
|
Specific fixed costs | ||
|
Total unit costs | ||
|
Total costs |
9.5x5000 = 47500 |
9.5x5000 = 47500 |
|
50000 — 47500 = 2500 |
50000 — 47500 = 2500 |
Both companies are considering ways to increase profits. One of them is to start selling its products to a large but relatively low-income (or economical) segment of customers who are not currently served by anyone. The potential capacity of this segment is 2000 pieces per month. Thus, a company that has captured this segment will have sales in physical terms increase by 40%. The only problem is that in this segment consumers will buy parts at a price no higher than 8.50 USD. i.e. per piece, i.e. 15% lower than the market price and 1 USD. i.e. below total production costs at the moment. “How can you sell at a price below cost”? — the head of the PEO with many years of work experience at the Staromekhanicheskiy Zavod is indignant.
Question 1: Let's say both companies can segment the market without additional costs (that is, start selling parts to the economical segment with a 15% discount, without undermining their sales at full price to wealthy buyers). How much will each company be able to increase profits if it increases sales (in units): a) by 20%, that is, capturing half of the economy segment?
b) by 40%, capturing the entire economy segment?
Should one or both companies seize this opportunity to increase profits?
|
Question |
Response logic |
"Foreign Automation" |
"Old Mechanical Plant" |
|
The profit increase (Δπ) is calculated through the marginal profit per unit of production in an additional batch (αμπ) |
αμπ = 8.5 - 2.5 = 6 Δπ = 6x1000 = 6000 |
αμπ = 8.5 - 5.5 = 3 Δπ = 3x1000 = 3000 |
|
|
αμπ = 8.5 - 2.5 = 6 Δπ = 6x 2000 = 12000 |
αμπ = 8.5 - 5.5 = 3 Δπ = 3x2000 = 6000 |
||
Conclusion: Both companies will be happy to “catch” even half of the economy segment, not to mention the happiness of taking over it entirely.
Question 2: What to do if neither SMZ nor ZAM can effectively segment the market, and both firms will be forced to set a single price for all buyers (that is, 8.50 USD for both the economical segment and wealthy buyers ).
A. Calculate the BOP (break-even sales volume) for each
companies, if the price is reduced to 8.50 USD. e.
b. How much will each company's profits increase if its sales
will increase by 40% (in units)?
Attention: BOP (break-even sales volume) in this case assumes that the company should receive the same, and not zero, profits.
Break-even sales volume is found in practice more often than classic CVP analysis. It is found in life, but not always in textbooks. This is a variant of the target profit point in dynamics: when factors change, profit remains at the same level. Break-even sales volume assumes that the company should receive the same profits during changes, and not zero. For example, an old machine is replaced with a more high-performance and expensive one. Naturally, the question arises: how much should output be increased in order to “recover costs”?
|
Question |
Response logic |
"Foreign Automation" |
"Old Mechanical Plant" |
|
|
Calculated through the equality of marginal profits before and after changes |
μπ (up to) = 7.5x5000 = 37500 = μπ (after) = 6xQ μπ (after) = 7.5x5000 =37500 |
μπ (up to) = 4.5x5000 = 22500 = μπ (after) = 3xQ |
||
|
b. Output growth by 40% |
Profit growth (Δπ) is calculated as the difference in marginal profits before and after changes |
μπ (after) = 6x7000 = 42000 μπ = 42000 - 37500 = 4500 |
μπ (after) = 4.5x5000 = 22500 |
|
This is what we call a competitive cost structure with lower average variable costs. “Foreign Automation” will withstand the price reduction, but “Old Mechanical Plant” will not. Dumping (playing to lower prices) is the destiny of firms with low variable costs. Fixed costs have nothing to do with it.
Question 3: While the companies were thinking, a strong competitor, the Automobile Plant, invaded their market. He easily captured half the market, selling the same parts for 9 USD. We will have to return to the original situation and analyze the reliability of SMZ and ZAM. Both companies lost half of their sales (in units). The results are presented in table. 2.
Table 2. The situation after the invasion of the “adversary” (in monetary units)
|
Indicators |
"Foreign Automation" |
"Old Mechanical Plant" |
|
Sales, pcs. | ||
|
Price per piece, y. e. | ||
|
Specific | ||
|
variables | ||
|
costs | ||
|
Fixed costs (per month) | ||
|
Specific | ||
|
permanent |
14 = 35000: 2500 | |
|
costs | ||
|
Total unit costs | ||
|
Total costs |
16.5x2500 = 41250 |
13.5x2500 = 33750 |
|
22500 — 41250 = -18750 |
22500 — 33750 = -11250 |
Of course, both companies are at a loss, but it is perhaps easier for the Staromekhanichesky Zavod to bear them. This is what we call a robust cost structure with lower fixed costs.
Question 4: Morning. The invasion of the Automobile Plant turned out to be a nightmare. Assuming no company can segment the market, what advice would you make to each company regarding this opportunity?
Answer: “Foreign Automation” should reduce the price, but “Old Mechanical Plant” should not. ZAM has every chance to win price competition due to lower variable costs.
After analyzing the situation, ZAM decided to take advantage of the opportunity to sell parts to a new segment and reduced prices by 15%. Its sales increased to 7,000 units per month at a price of 8.50 USD. e. Belatedly, SMZ was also forced to reduce prices in order to retain its customers. SMZ management believes that if they had not reduced their prices, they would have lost 60% of sales. Unfortunately, after the price reduction, SMZ is operating at a loss.
Question 5: Was the decision of the Staromekhanichesky Zavod to reduce prices financially justified? Let’s say that if SMZ decides to completely leave this market, it will be able to cut fixed costs in half. For example, refuse to rent premises, land and other expenses. The remaining 50% of fixed costs is servicing a bank loan for the purchase of equipment that has zero salvage value. Calculate and compare profits for different options.
Position after price reduction:
μπ (up to) = 4.5x5000 = 22500
μπ (after) = 3x5000 = 15000
FC = 20000, π = -5000.
Alternative option: do not reduce the price, but lose part of the market:
μπ (up to) = 4.5x5000 = 22500
μπ (after) = 4.5x2000 = 9000
FC = 20000, π = -11000.
Therefore, reducing the price is beneficial in the short term.
When leaving the market π = -10000. Therefore, you should stay and reduce the price, although production will be unprofitable: FC = 20000, π = 15000 - 20000 = -5000.
Fortunately, the managers at the Old Mechanical Plant read Michael Porter's book Competitive Advantage and decided to analyze how the entire value chain works. As a result of market analysis, they found out that at least 3,500 parts are purchased monthly by drivers, who then must independently remake this part so that it better suits their car brand: namely, Volga. Thus, there is an opportunity on the market to produce a specialized version of the part for this category of drivers. And although production costs at SMZ will increase, the additional costs will still be less than what drivers currently spend on reworking parts.
To produce specialized parts, SMZ will have to invest additional capital, the fee for which will be 3000 USD. per month.
Question No. 6: In order to produce specialized parts, SMZ will have to buy new equipment and a new building, which will cost 23,000 USD. fixed costs per month instead of 20,000 USD. e. per month. The plant management is convinced that they will be able to sell specialized parts at 6.00 USD more than regular parts (i.e. 16.00 USD), however, specific variable costs will increase by 3.00 USD. e. per month. Will it be profitable for SMZ to focus on producing only specialized parts?
Answer: FC = 23000, π = (1b-8.5)x3500 - 23000 = 3250. Yes, manufacturing only specialized parts is profitable, since profit will increase by 3250 - 2500 = 750 USD. e.
Question #7: What is the minimum number of specialized parts that SMZ must sell per month to exceed the profits it currently earns as a manufacturer of standard parts? Remember? We called this break-even sales volume.
Answer: FC = 23000, π = (16-8.5)xQ - 23000 = 2500. Q = 3400.
Question No. 8: How much will the profits of the Old Mechanical Plant as a manufacturer of specialized parts increase if it sells 3,500 pieces per month at a price of 16 USD per piece. ?
Answer: 3250 — 2500 = 750.
“Unfamiliar options for break-even analysis”
There are other options for break-even analysis. For most they will be unexpected. We call them the “three break-even points”:
The first and most quickly achievable - the marginal break-even point - shows at what output the price will begin to pay for the additional costs of producing one more unit of output (P > MC - in conditions of perfect competition or MR > MC - in conditions of imperfect competition). The first condition (P > MC) corresponds to the spirit of management accounting and is quite worthy of use. The second (MR > MC) is only suitable for pure economic theory, although it would be presumptuous to deny the possibility of its practical use.
The second point - the break-even point of variable costs - shows the output at which it will be possible to cover all variable costs (TR > VC). Naturally, this formulation of the problem is typical for Variable Costing. In the case of Direct Costing, a similar point will be called the break-even point of direct costs (TR > DC).
The third point - classic - sets the output at which it will be possible to cover all costs (TR > TC). It has filled all textbooks, so most students and specialists think that the classic break-even point is CVP analysis. This is a clear exaggeration, or rather an understatement of the role and capabilities of CVP analysis.
Example. Assessing the performance of company stores and allocating general administrative costs
At the beginning of the year, a large Moscow company set an ambitious goal: to open 200 new branded stores throughout the country in a couple of years. The central office economist asked how to allocate central office costs between stores? The answer, surprisingly, relies on the “three break-even points”:
1. A newly opened store must first pay for its current maintenance. This is the first and specific task for management. It is not necessary to allocate costs to such stores. This is also the marginal break-even point, only not for products, but for stores. All other things being equal, the team that passes the first stage faster will “win the capitalist competition.” No one has canceled moral incentives.
2. Once the store contributes to the cover, another stage of development will begin. Here you need to recoup the accumulated current losses of the previous stage. This is also a kind of break-even point for variable costs, only not for products, but for stores.
3. Only at the next, third stage should we fight for classic payback. And only here can you distribute the costs of the central office between stores. Advanced Direct Costing welcomes this decision, but does not provide advice on which indirect cost allocation bases to use.
It is precisely this decision that the business plan of each store or branch, representative office, business area, and so on should be aimed at.
O.V. Grishchenko
Management Accounting
Lecture notes. Taganrog: TTI SFU, 2007.
6. USE OF ACCOUNTING INFORMATION IN THE PROCESS OF MAKING MANAGEMENT DECISIONS
6.2. One-component break-even analysis
Break-even analysis is a fairly simple in form and deep in content tool for planning and making management decisions in a commercial organization. The basis for making decisions regarding production activities is to consider options for possible changes in the market situation. Since the enterprise plan is a system of indicator values that the enterprise intends to achieve in the future, its implementation will depend on many factors. In the process of drawing up plans, the management of the enterprise will have to solve the following tasks:
– determine the volume of production that will not only cover costs, but also allow you to obtain the desired level of profit;
– determine the level of costs that allows you to remain competitive in the market.
Break-even analysis allows you to solve these problems. There are other names for this procedure in the literature, for example: “critical sales volume method”, “dead point method”, “zero profit point method”, “operational analysis”, “margin method”, cost-volume-profit method ", or CVP analysis (Cost - Volume - Profit).
The essence of the method is to determine for each specific situation the volume of output that ensures break-even activity.
One-component break-even analysis.
The simplest is the break-even analysis of single-product production, i.e. production that produces only one type of product. In general, without taking into account tax effects, the operating profit of an enterprise (P) for the reporting period is formed as follows:
P = VR – Zpost – Zper;
where BP is the enterprise’s revenue for the period in monetary units, BP = q × Q;
ts – selling price per unit of production, rub.;
Q – sales volume in physical terms, pcs, kg, etc.;
Zpost – fixed costs, rub.;
Zper – total variable costs, rub.
If we denote specific variable costs in rubles. – zper, then the formula can be presented in the following form:
P = (c – zper) × Q – Zper.
Break even(Qcr)– this is an indicator characterizing the volume of product sales at which the enterprise’s revenue from the sale of products (works, services) allows it to cover all expenses and reach a zero profit level (P = 0). The break-even point can be found from the equation:
Another important value that characterizes the cost structure of an enterprise is the value marginal incomeor contribution enterprises. Marginal income at manufacturing enterprises is considered to be the difference between the enterprise's revenue from the sale of products (works, services) and the variable costs that the enterprise incurred in the process of producing these products (works, services). There are different amounts of total marginal income (MI):
MD= BP – Zper = c × Q – zper × Q = (c – zper) × Q
and specific marginal income ( md):
md= c – zper.
There is another way to determine the amount of marginal income. The amount of marginal income can be determined by adding the fixed costs and profit of the enterprise:
MD = Zpost. + P.
The dependence model of the indicators under consideration can be constructed graphically (Fig. 6.2).

Rice. 6.2. Break-even chart
A widely used and very clear representation of profit growth above the break-even point is shown in Fig. 7.3. In this graph, straight line 3 complete is the x-axis. The ordinate axis reflects the amount of “divergence” between straight lines "Revenue" And Zfull, i.e. the amount of profit. When the output is below Qcr, the value on the ordinate axis will be negative (which corresponds to losses), and above Qcr - positive (profit). The slope of this graph to the x-axis will be equal to specific marginal income, and its intersection with the ordinate axis is the value Zfast, which is understandable - with zero output, losses are equal to the amount of fixed costs.

Rice. 6.3. Dependence of profit on output volume
The volume of production Qкр corresponds to the amount of revenue ВРкр, which, by analogy with output, is also called break-even point, in monetary units only:
![]()
or otherwise:
 ,
,
Where UMD– share of marginal income in price.
The conclusion follows from the second formula: the higher the share of variable costs in the sales price of the product (ratio zper / c), the higher the break-even point. Otherwise, the lower the share of marginal income in revenue, the more products the company should produce in order to cover fixed costs and start making a profit.
Another indicator is calculated within the framework of break-even analysis - safety threshold(otherwise called marginal safety margin).This indicator is calculated asthe difference between actual volume and break-even point andindicates how much output can be reduced before the enterprise begins to incur losses. As already noted, the larger the output, the higher the profit. The higher the production volume, the less frightening an enterprise is from fluctuations in market conditions - the more fluctuations in costs and revenue it can safely endure, remaining in the “profit zone.”
Obviously, each specific volume of output has its own volume of security.
Let's look at the break-even analysis technique using an example.
Example.
The Zarya production enterprise produces dumplings. To develop a work plan for the next quarter, a break-even analysis of this single-product production is carried out. Planned variable costs for finished products of the enterprise are 3 per = 39 rubles. Fixed expenses for the quarter will be Z post = 480,000 rub. The selling price of dumplings is planned at the level of c = 67.5 rubles. Break even
![]() .
.
This volume of production will allow you to cover all costs and reach zero profit. If production for the quarter does not reach, the financial result of the enterprise will be negative, and the activity will be unprofitable.
Based on the level of annual profitability desired by the owners of the enterprise, the following level of target profit has been set - 100,000 rubles. Let's calculate what volume of output will allow us to get such a profit.
Having studied the market situation and the capabilities of their own enterprise, Zarya management planned the production volume of Q dumplings for the next quarter - . With this volume of production, the profit level will be:
P = (c – zper) × Qcr – Zper. = (67.5 – 39) × 20,000 – 480,000 = 90,000 rub.
Break even
Safety threshold:
The company's flexible budget provides for the possibility of an unfavorable situation in the planning period, which may lead to an increase in rent and, accordingly, fixed costs by 40,000 rubles. Managers of the organization do not consider it possible to increase the selling price of dumplings, since it is determined by the market. The simplest way to maintain the estimated level of profit is to cut variable costs. What savings in variable costs (s*per) will allow you to cope with an unfavorable situation?
Consequently, the company should achieve savings in variable costs in the amount of (39 – 37) = 2 rubles. on products. However, technologists and employees of the supply department, having studied all the possibilities for saving variable costs, came to the conclusion that it was impossible to achieve savings of more than 1.3 rubles. What fixed cost savings will this situation require?
Z*post = (c – z*per) × Qplan – P = (67.5 – 37.7) × 20,000 – 90,000 = 506,000 rub.
506,000 – 40,000 = 466,000 rubles.
480,000 – 466,000 = 14,000 rubles.
Thus, in order to compensate for a possible increase in rent, enterprise managers should, in addition to saving variable costs in the amount of 1.3 rubles. on products, it is necessary to find an opportunity to save 14,000 rubles in the existing structure of fixed costs.
Sales volume is the main indicator of a company's performance. It can be expressed in the actual number of units of products sold or in the total amount of funds received into the company’s account after the sale of goods. In economic analysis, gross, net, target and critical OP are calculated. The indicator is used in analyzing profits, costs, and break-even points. The source of information is financial reports, primary accounting documents, and management accounting data.
The central indicator reflecting the performance of any company is sales volume. It shows how many products, works and services the company created and sold. The profit and value of the business depend on the result obtained.
Volume of sales(Sales volume - SV, OP) is an indicator of the company’s operating results, which is represented by the total amount of revenue received over a certain period of sales of products, works, and services. It is often called the volume of product sales and is considered as a synonym for revenue.
Reference! Sales volume in financial analysis is expressed in monetary units (rubles, dollars, euros, etc.). However, for management accounting purposes, the possibility of using natural units (pieces, kg, m, etc.) is not excluded.
It is most convenient to consider the SV indicator as the actual amount of funds received into the company’s accounts during a certain period.
Break-even analysis
In the future, other indicators of economic analysis are calculated on its basis.
- If you subtract the cost of production from the OP, you can get a gross profit - a more accurate reflection of the efficiency of a business entity.
- If you compare the indicator with fixed and variable costs, you can calculate the break-even point.
Important point! When analyzing EP, it is impossible to compare it with the indicator of other companies or the industry average. It is compared with the results of the same company for previous periods or planned targets.
Sales volume reflects not only the company's performance, but also the situation on the market: if demand for a product decreases, a high-quality substitute appears, or legal restrictions come into force, it will decline.
Sales volume: classification
In modern practice of economic analysis, several types of OP indicator are used:
- Gross - total sales for the reporting period at full prices without taking into account returns, discounts and other adjustments.
- Net - gross OP with the deduction of returns, benefits, discounts and other concessions to customers, which allows it to be used in assessing the efficiency of a company’s functioning and forecasting.
- Target - a planned indicator obtained by calculation based on information about the target profit.
Critical - the minimum amount of income that, even with unfavorable demand, allows the company to avoid losses.

Figure 1. Break-even point and critical sales volume
Formula for calculating sales volume
To determine the volume of product sales, it is not enough to use data from the company’s public financial statements: it will require the accumulation of information from primary accounting documents and internal management accounting documents.
The formula for estimating SV in general can be represented as an identity:
OP = (UPZ + EBIT) / (Tsed - Pred), where:
SPL - the sum of semi-fixed costs;
EBIT - profit before taxes;
Tsed - cost per unit of production;
Pre - variable costs for each unit of goods.
Reference! Semi-fixed costs are expenses that remain unchanged even if the volume of output varies. These include depreciation of buildings and structures, enterprise management costs, rental payments, etc. Variable costs, on the contrary, change along with an increase or decrease in the number of products produced.
The meaning of the indicator and its analysis
Since the OP formula takes into account costs and profit volume, this indicator is used in the analysis:
- Dynamics of actual sales volume.
- Changes in price levels.
- Volatility of production and distribution costs.
- Marginal income.
- Market demand, etc.
Important point! The total sales volume is an absolute indicator. It can be compared with the performance of competing firms when it comes to assessing market shares. In other cases, the dynamics of Sales volume are analyzed, as well as its proximity to the target value.
There is no general normative value for SV. Each company determines for itself a critical sales volume and target values, which become guidelines for changes in the indicator.
Reference! To determine the critical OP, the formula KOP = UPZ / (Tsed - Prev) is used, since the profit at the break-even point is zero.
The process of assessing the dynamics of a company's sales volume is presented in the video
Examples of coefficient calculation
In order to understand the practical application of the formula for calculating sales volume and analyzing this indicator, it is worth considering a ready-made example of calculating this indicator for the Kub company, which sells a standard model of DVRs.
Important point! If a company sells several types of products with different costs and prices, then SV is calculated separately for each type of product.
Conclusion! For three years, the OP of the Kub company has been decreasing. This negative trend occurs against the backdrop of rising EBIT and unit prices. Consequently, the reason for the reduction could only be a drop in the physical quantity of sold products.
It is worth noting that the critical output volume of the enterprise under study varies from year to year. However, it is lower than the obtained value and is 6.5, 6.1 and 6, respectively.
Conclusion! Until the actual SV value approaches the critical value, no action can be taken, but an unfavorable trend should be monitored.
A detailed scheme for calculating the volume of sales of goods, works, services and its critical value is given in a sample compiled on the basis of the tools of the Excel spreadsheet editor.
Questions and answers on the topic
No questions have been asked about the material yet, you have the opportunity to be the first to do so
Calculating the break-even point in Excel with examples
The break-even point reflects the volume of production, sales of goods and services, which covers all costs of the enterprise.
CVP analysis: calculation of marginal income and break-even point
In an economic sense, it is an indicator of a critical situation when profits and losses are zero. This indicator is expressed in quantitative or monetary units.
The lower the break-even point of production and sales volume, the higher the solvency and financial stability of the company.
Break-even point formula in Excel
There are 2 ways to calculate the break-even point in Excel:
- In monetary terms: (revenue * fixed costs) / (revenue - variable costs).
- In natural units: fixed costs / (price – average variable costs).
Attention! Variable costs are taken on a per unit basis (not total).
To find breakeven, you need to know:
Fixed costs (not dependent on the production process or sales) - rent payments, taxes, salaries for management personnel, leasing payments, etc.
Variable costs (depending on production volumes) - the cost of raw materials and materials, utility bills in production premises, workers' salaries, etc.
Selling price per unit of goods.
Let's enter the data into an Excel table:
- Find the volume of production at which the company will receive a net profit. Establish the relationship between these parameters.
- Calculate the volume of sales of goods at which the break-even point will occur.
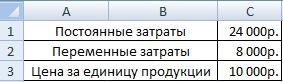
To solve these problems, we compose the following table with formulas:

- Variable costs depend on the volume of products produced.
- Total costs are the sum of variable and fixed costs.
- Income is the product of production volume and product price.
- Contribution margin is total revenue minus variable costs.
- Net profit is income without fixed and variable production costs.
Let’s fill out the table and see at what output the enterprise will be “in the black.”

Starting from the 13th production, net profit became positive. And at the break-even point it equals zero. Production volume – 12 units of goods. And the income from sales is 120,000 rubles.
How to graph the break-even point in Excel
To clearly demonstrate the economic and financial condition of the enterprise, we will draw up a graph:
- We decide on the appearance of the graph and click the “Select data” button.
- For demonstration, we need the columns “Total Costs”, “Revenue”, “Net Profit”. These are the elements of the legend - “Rows”. We manually enter the “Row Name”. And in the “Values” line we make a link to the corresponding column with data.
- The range of horizontal axis labels is “Production Volume”.
We get a graph like:

Let's change the graph (chart layout) a little.
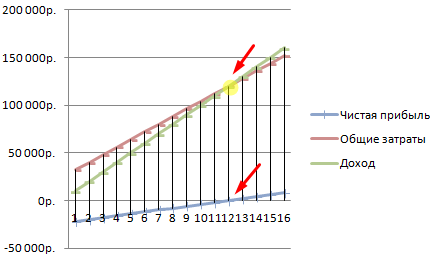
This demonstration allows us to see that the net profit at the break-even point is indeed “zero”. And it was after the twelfth production release that “plus” began.
Where are such calculations needed?
The “break-even point” indicator is in demand in economic practice to solve the following problems:
- Calculation of the optimal price for the product.
- Calculation of the amount of costs at which the company still remains competitive.
- Drawing up a product sales plan.
- Finding the volume of output at which profitability will appear.
- Analysis of the financial condition and solvency of the enterprise.
- Finding the minimum production volume.
Ready-made calculations and templates for analyzing an enterprise’s break-even point:
The results of such calculations are in demand by both internal and external users. Break-even is taken into account when making management decisions and gives an idea of the financial condition of the company. The use of such a model is a way to assess the critical level of production volume and sales of goods and services.
Online break-even point calculator
What is the break-even point and how to calculate it yourself
Let's look at the instructions for independently calculating the break-even point, with two test examples with formulas and graphs for retail trade and manufacturing activities.
The goal of any business is to make a profit. Every businessman has to predict the development of production, which is especially important when planning any new directions in it. Therefore, before the start of implementation, it is necessary to understand how effective the planned project will be, to assess the volume of investments, payback periods and financial risks. To carry out this assessment, there is an economic indicator - break-even point or, as it is also called break-evenpoint - BEP. Let's talk about this important economic tool, the need for its use and calculation methods.
Download two ready-made models for calculating the break-even point in Excel format for retail and industrial activities. In the examples given, you can change the source data to suit your numbers and calculate the BER directly for your project.
What does the break-even point mean, its importance in the functioning of the enterprise
The indicator determines the sales volume required to cover costs. Profit, which is the difference between revenue and expenses, is equal to zero. Those. The break-even point is the level of sales at which there is no profit and no loss.
It is calculated both in natural units and in value equivalent. This economic instrument determines the number of units of products, services or goods that need to be sold to cover costs and reach zero profit, as well as their cost. If the level of sales volume has not reached the calculated BEP indicator, it means that the company is incurring losses, and on the contrary, if it exceeds the sales volume, it means that the organization, having crossed the zero line, is making a profit.
What does the break-even point show?
- The BEP indicator determines such an important aspect of the company’s functioning as its financial stability. For example, an increase in the BEP value indicates objective or private problems in the company that led to a larger sales volume to achieve a zero profit threshold. The reasons for the growth of the indicator are the expansion and change in the structure of production, which invariably entails an increase in trade turnover, fluctuations in market prices, etc.
- The BER value allows the company to analyze the feasibility of investing in a new project, comparing the rate of self-repayment with the required sales volume, and its fluctuations - to establish the causes of problems in the company and their timely elimination, if they are not of a global nature.
- Calculating the break-even point of a project makes it possible to calculate optimal changes in sales volumes and product costs for more comfortable and flexible business. For example, calculate the non-critical value of the reduction in revenue in order to increase sales volumes, while operating at break-even and creating sufficient reserves.
Basic indicators for calculations
The calculation of BEP is based on information from production cost accounts. It is important here to divide them into constants and variables. Fixed expenses include expenses whose value does not change from month to month and does not respond to fluctuations in output and sales. It can be:
- depreciation of machines and equipment;
- salary of the AUP and social contributions accrued to it;
- rental, utility and other payments of an unchangeable nature.
Variable costs include:
- expenses for the purchase of raw materials and supplies for the product manufacturing process;
- payment for fuel and energy resources involved in the work process;
- wages of shop workers (with deductions), etc.
Fixed costs may change due to various reasons, for example, reduction/increase in production capacity, increase in energy tariffs, changes in rental payments, acquisition/disposal of equipment, inflation and other factors. The amount of variable costs fluctuates depending on the volume of output and sales.
Formulas for calculating break-even point
As already mentioned, calculations can be made in physical and monetary terms. Let's look at the basic data needed for calculations in units. Calculation data required:
- fixed costs for the full volume (Zpost);
- unit prices of a product or commodity (Tsed);
- variable costs per unit (Zper/unit).
Formula VER in units: BEPed= Zpost/(Tsed- Zper/unit) shows the sales volume in units to reach zero profit.
Calculating the value of BEP in monetary terms will require the use of the following data:
- fixed costs for the full volume (Zpost);
- revenue (B);
- product unit price (Tsed);
- variable costs for the full volume (Zper) and unit of goods (Zper/unit).
At the first stage of calculations, marginal income (Dm) is found, which is the difference between revenue and variable costs according to the formula: Dm= B - Zper.
Based on it, the coefficient (share) of marginal income in total revenue is calculated Kdm= Dm/V.
Using the coefficient, the value of BER is calculated in monetary terms: VERDEN = Zpost / Kdm
When forecasting new business directions, it is sometimes impossible to calculate the marginal income for the entire sales volume. In this case, the values of price and variable costs per unit of product or product are used, taking as a basis the formula
Dm/unit = C - Zper/unit, where Dm/unit is marginal income per unit.
When calculating the coefficient, this indicator is also used, comparing its value with the price of the product, because it is the revenue from the sale of a unit of goods:
Kdm= Dm/unit/Tsed, and get the coefficient value exactly the same as when calculating the entire sales volume.
So, the break-even point in value terms is calculated using the formula
VERDEN = Zpost / Kdm.
This indicator is also called the profitability threshold, which is very true, since by crossing this threshold - the amount that covers the invested costs, the company begins to make a profit.
Let's look at examples of calculating the break-even point for companies of different types of activities.
Example No. 1: calculating the break-even point for a retail enterprise
Let's calculate the profitability threshold for a women's clothing store. The assortment of a retail outlet is usually quite wide, so the practice of calculating in monetary terms is used here.
Fixed costs of a trading enterprise include costs associated with the work process:
- payment for rent of retail space, communication services, security, utilities, etc.;
- wages of sellers and contributions to extra-budgetary funds;
- advertising expenses.
Variable costs consist of sales volume and purchase price per unit of goods. Let's consider the presented table, which contains data for calculating the profitability threshold broken down into variable and fixed costs, calculated marginal income and its share in total revenue, and also calculated the required sales volume to reach a zero profit level.

Using the formulas, after calculating fixed and variable costs, we calculate:
- marginal income Dm = B - Zper. = 1,420,000 - 650,000 = 770,000 rubles
- margin coefficient Kdm = Dm / V = 770,000 / 1,420,000 = 0.542
- break-even point VERDEN = Zpost / Kdm = 155,000 / 0.542 = 285,844 rubles.
Conclusion: to cover the investment, sales in the amount of 285,844 rubles will have to be made, and sales of goods above this level will begin to make a profit.
Download break-even point calculation in excel for retail trade.
Features and methods of calculating the break-even point
The low complexity of the calculations in the previous example is due to the ideal conditions of the implied environment, which do not take into account the constantly changing market.
What is the break-even point and how to calculate it
The calculations of our examples allow for the persistence of such situations:
- the company does not change the price of products when sales volume increases;
- costs (both types) do not change. In reality, an increase in sales volume usually causes an increase in costs and expenses;
- the volume of production assumes full implementation, which is also rare in the process of activity.
Of course, this does not happen in life, but we provide an algorithm for the correct calculation, and the businessman himself has to adjust the calculations in accordance with the current market situation. There are different methods for calculating break-even point:
- mathematical (presented in example No. 1);
- graphic (more visual).
Both methods are very effective in calculating the indicator and are quite simple. Let's look at them using the following example.
Example No. 2: calculating the value of BER for a manufacturing enterprise
Industrial enterprises specializing in the production of products often produce a limited range of homogeneous products, for example, prefabricated parts of one unit. This method of planning production saves costs and greatly facilitates the calculation of the break-even point. For companies that produce a small number of items, it is easier to calculate the BEP indicator in natural values. Expanded production involves unification by product groups. In the presented example, there is a small enterprise that produces five types of products.

The calculation of the break-even point involves expenses grouped by variable and constant characteristics. We calculate the BER indicator in physical terms using the formula:
BEPed= Zpost/(Tsed-Zper/unit) = 281,400 / (674.71 - 332.35) = 930.7 units.
To calculate the indicator in monetary terms, you can use the following formula:
VERDEN = B * Zpost / (B - Zper) = 1,079,000 * 281,400 / (1,079,000 - 565,000) = 590,721.01 rub.
Conclusion: in order to reach a zero profit level, covering the invested costs, you should sell 930.7 units. products worth RUB 590,721.01. Subsequent sales will already be profitable and will begin to make a profit.
The graphical method for determining the value of VER is more visual. To do this, you need to build a graph by grouping the necessary data into a table.
The graph is constructed in the classical system, plotting data on production volume along the horizontal axis and revenue along the vertical axis. Using tabular information, they build revenue and cost lines.

The point of intersection of the line of received (or planned) revenue with the line of total costs is the break-even point. If you lower the perpendicular to the sales volume axis, you can find out the number of products required for sales in order to achieve a state of no losses and no profit. The value expression of this point is determined by drawing a perpendicular to the vertical axis. The graph clearly confirms the correctness of the mathematical calculations - 930.7 units should be sold. in the amount of RUB 580,721.01 to reach zero losses.
Downloadable model for a manufacturing plant.
If you have any clarifying questions about the calculation method or any difficulties using the formulas, ask them on the forum, we will help you figure it out.
Break even
Break even- the sales volume at which the company covers all its expenses without making a profit.
Its value plays an important role in the sustainability and solvency of the company. The degree to which sales volumes exceed the break-even point determines the margin of financial strength (margin of stability) of the enterprise. In turn, how profit grows with changes in revenue is shown by Operating Leverage (operating leverage).
Formula for calculating break-even point
To calculate the break-even point, you need to divide the costs into two components:
- Variable costs- increase in proportion to the increase in production (volume of sales of goods).
- Fixed costs- do not depend on the number of products produced (goods sold) and on whether the volume of transactions grows or falls.
Let us introduce the following notation:
| IN | — | sales revenue. |
| Rn | — | sales volume in physical terms. |
| Zper | — | variable costs. |
| Zpost | — | fixed costs. |
| C | — | price per piece |
| ZSper | — | average variable costs (per unit of production). |
| Tbd | — | break-even point in monetary terms. |
| Tbn | — | break-even point in physical terms. |
Formula for calculating the break-even point in monetary terms:
(in rubles, dollars, etc.)
Tbd = V*Zpost/(V - Zper)
Formula for calculating the break-even point in physical terms:
(in pieces, kilograms, meters, etc.)
Tbn = Zpost / (C - ZSper)
Example of calculating the break-even point
Look at the Excel spreadsheet
with a large assortment"
Calculation and graphs
The same data on the graph. Break-even point Tbn = 20 pieces

At the break-even point, the income line crosses and goes above the total cost line, the profit line crosses 0 - it moves from the loss zone to the profit zone.
How fixed costs, variable costs and price affect the break-even point, see Calculation of the break-even point, examples and graphs.
At first glance, the formula for calculating the break-even point is quite simple, and there should not be any difficulties in calculating it. But in reality, everything is not so simple.
Four important assumptions when calculating the break-even point
- We are talking about revenue (sales volume), so we believe that all sold produced or purchased products. Warehouse inventories are not taken into account.
- Variable costs are directly proportional depend on sales volume. This doesn't always happen.
Procedure and rules for calculating the break-even point
For example, the case where in order to increase production volume it was necessary to build a new workshop will have to be calculated in a more complex way.
- Fixed costs do not depend from sales volume. This doesn't always happen either. If, in order to increase production volume, it was necessary to build a new workshop, hire more management personnel, increase payment for utilities - this case also does not fit the general formula.
- Break-even point is calculated for the enterprise as a whole or for some average product.
When calculating the break-even point, probably the most important limitation is assumption 4. To make the calculation for each product separately, you need to know what share of fixed costs falls on each product. If there are many products, calculating break-even points separately for each product becomes a complex task that requires a large amount of calculations.
Look at the Excel spreadsheet
“Break-even point and break-even analysis
with a large assortment"
Profitability, Min. markup, Marginal profit, Margin of safety
Calculation and graphs
Determining the break-even point is a task that must be set and solved in any company, regardless of whether it is at the beginning of its journey or has been operating in the market for a long time.
The break-even point of products and services represents a certain state in time, the moment at which all costs are compensated by profits from the activities of the enterprise. That is, you go to zero.
After the break-even point has been passed, the profit from the sale of each subsequent unit of production begins to exceed costs.
The break-even point of an enterprise can be expressed in money and units of production.
Break-even point: why work with it
There are several times when you will need to calculate your break-even point.
It is always important to know how much to produce and sell, that is, volume. The break-even point allows you to analyze what volume should be when the price changes and, conversely, how changes in volume can affect the price.
The break-even point of production and its use gives an understanding of at what level the reduction in turnover becomes critical. This way, you won’t miss the moment when a company or an individual project becomes unprofitable. When the break-even point of sales is involved in such calculations, it is customary to talk about a new parameter - a margin of safety.
Achieving self-sufficiency should be determined not only for the entire enterprise as a whole, but also by entering new markets, mastering unknown areas, and implementing ambitious projects.
In addition, a change in the indicator under consideration may indicate the emergence of certain difficulties. That is why this indicator should be taken regularly and be an integral part of the entire set of analytical parameters that reflect the pace of business development.
Break-even point: what to consider
There are certain algorithms that allow you to prepare to understand when a startup, a new direction, or a project will reach self-sufficiency.
1. Collection of information on profits, expenses and production / sales volumes
The first thing you need to do is collect information about profits, expenses and production volumes (if you have production), volumes of sales of services (if you have services).
2. Determination of fixed and variable costs
Let us remind you what fixed and variable costs are.
Fixed costs
Let's start with the constants. These traditionally include such things as:
- costs of renting premises;
- expenses for salaries of the administrative corps and top management of the enterprise;
- communication costs;
- depreciation.
Fixed costs remain so, all other things being equal, as academically competent economists like to say. But if you are developing a strategy that should lead to a breakthrough: opening a new division, office, branch, production, etc., then fixed costs will reach a new level. Their value does not change smoothly, but in a “stepwise” manner.
Variable costs
Variable costs are those costs whose value will vary depending on the size of the business. Here we can talk about changes in sales and production volumes.
The list of such costs usually includes:
- piecework wages, and sometimes wages for workers;
- fuel and electricity that will be used for production needs;
- materials and raw materials;
- purchases of semi-finished products and necessary spare parts for production;
- sometimes certain types of indirect costs: tools, auxiliary materials, etc.
If we go a little deeper, variable costs can be divided into 2 more types:
- linear;
- nonlinear.
Thus, linear variable costs per unit of production always remain unchanged. This means that to produce 1 piece of a particular product, equal volumes of raw materials are spent.
As for nonlinear variable costs, they can either increase or decrease as the business grows.
3. Assessment of sales volumes for the financial stability of the enterprise
At the last stage of preparation for all calculations, you should analyze and evaluate the sales volumes of the product, at which the business will not be at risk of costs exceeding profits.
How to calculate break-even point
Now we will give the formula and finally understand what the break-even point is mathematically. The formula for calculating this value once again confirms how important it is to understand your fixed and variable costs.
Fixed costs / (Revenue – Variable costs) * Revenue
Remember that all these calculations must be carried out with a certain systematicity. The described quantity is unstable. It “floats” depending on what factors affect the business. Based on the presented formula, one can easily assume that when planning multiple revenue growth and implementing these plans, the desired indicator will also change its position. And this is not to mention the fact that when scaling a business, both fixed and variable costs increase.
Calculating such an indicator is important for almost any enterprise. Does it sell finished products or produce its own? After all, it is necessary to know when an open enterprise or store will recoup the money invested in it and begin to make a profit.
What is the break-even point and what does it show?
This indicator is important not only for the enterprise, but also for potential investors. After all, they first of all look at this indicator, since it is important to determine when the enterprise will begin to generate income and thereby indicate its attractiveness in investment terms. So this indicator significantly influences the decision to invest financial assets.
The break-even point shows the volume of product sales at which profit is equal to . Profit is determined by the difference in costs and revenue per unit of production.
The break-even point indicator is determined in monetary terms and in physical terms. By considering the value of this indicator, you can understand how much it will be necessary to produce products, provide services, or fulfill orders in order to cover initial costs and make zero profit. So the break-even point as a result reflects how income compares with expenses.
When this point is exceeded, the company receives a profit, and if it does not reach it, it receives fixed costs.
T.B. indicator company is necessary to determine the financial stability of the enterprise. For example, if this indicator is constantly increasing, then this is a clear signal that the company is having problems making a profit. We should not forget that T.B. may change as production or trade turnover expands. Basically, with such indicators it decreases.
To summarize, calculating such an indicator provides the following opportunities:
- Decide whether it is worth investing your money in this project if it comes after the release of several batches of products;
- Identify possible problems at the enterprise associated with constant changes in technical requirements;
- You can find out the dependence of sales volume on the price of products. In this way, you can reduce or increase sales volume depending on price changes;
- Calculate by what acceptable value it is necessary to reduce profit in order not to end up at a loss.
In addition, in large manufacturing enterprises this indicator serves as the main criterion for pricing its products. This indicator is also taken into account when deciding to introduce discounts on products.
T.B. it is also necessary to indicate in the business plans being developed about the opening of a new production facility or retail outlet.
Break-even point - how to calculate?
Before you begin calculating your break-even point, you will first need to consider your business's costs. They will need to be distributed between constants and variables. This action will affect the accuracy of subsequent calculations.
The constants include:
- Depreciation expenses (included in the cost of the product itself);
- Salaries of administration personnel (with all deductions and payments);
- Rent;
- Purchase of raw materials.
Variables include:
- Purchase and repair of components;
- Fuel and other combustible materials necessary to support the production process;
- Salaries of main workers.

Note that fixed costs cannot depend on the amount of volume and sales. In addition, these expenses will not change much over time. In order for them to change, the following points must be changed:
- Increase or decrease in production at the enterprise;
- Opening or closing of an additional department, workshop, production line;
- Increase or decrease in rent;
- Big inflation.
However, they may not change at all with an increase in the volume of production. Therefore, such costs are attributed as temporarily constant per unit of goods produced.
Calculation formula
This indicator is calculated using the following formula:
T.B.=Pos.Z.? (Doh. -Per. Z.)
- T.B. - break even;
- Pos. Z. – Fixed costs;
- Ext. – Income;
- Per. Z. – Variable costs.
Using the data obtained as a result of calculation using this formula, you can obtain indicators of the critical sales volume in numerical values.
To calculate this indicator in financial terms, you must have the following expressions in the data:
- Pos. Z. – fixed costs;
- Ext. – Income;
- Per. Z. – variable costs.
To calculate this indicator in monetary format, you will need to calculate the marginal income. Contribution margin is the difference between income and variable costs. It is determined by the following formula:
M=Doh. -Per. Z.
The marginal income ratio we need is calculated using the following formula:
After calculating this indicator, you can finally begin to calculate T.B. in monetary format:
T.B. den.=Pos. Z.?KM
Using this formula, you will get the value at which your revenue will cover the costs of production needs.
In order to better understand this material, it is better to consider this indicator using an example.
Examples of break-even point calculations
For the first example, it is best to consider a clothing store, because thanks to its work, T.B. for him it is calculated only in the financial version.
For a clothing store located in a shopping center, the following items can be included in fixed expenses:
- Renting premises;
- Employee salaries;
- Insurance contributions from salary;
- Payment of utility services;
- Payment for advertising campaigns.
Our example shows that fixed costs in this store will be equal to 336,000 rubles. And his income will be about 2,300,000 rubles. So, let's calculate the marginal income:
KM =1800000?2300000= 0.78 rub.
T.B. den.=336000?0.78=430769 rub.
This indicator tells us that the store will need to sell its products in the amount of 430,769 rubles in order to achieve self-sufficiency. We can also find out that this store has a so-called capital reserve; this indicator tells how much you can reduce your income so as not to go into constant expenses.
Let's look at the second example against the backdrop of a manufacturing plant.
Basically, all enterprises that produce their products are designed to create only one type of product. Thanks to this, their costs are the most optimal. At the same time, T.B. is calculated numerically for this type of product.
The price of one produced product is 350 rubles
Let's calculate T.B. for the enterprise using the initial data:
T.B. =265000?350-280=3785
This value means how many units of product the company needs to produce in order for its costs to reach zero. If the output is large, the enterprise will begin to make its profit.
This indicator as a whole is an important criterion for further planning of possible volumes of production or sales of goods. In addition, this value gives an understanding of how large the difference is between expenses and income per unit of production. With the help of which you can better control changes in price formations.
In addition, this indicator is of paramount importance for investors, as it is how they judge the attractiveness of investing in an idea or company.
In contact with
Seminar 4.2.
Corporate profit management - 4 hours
Issues for discussion
- Describe the company's profit management mechanism.
- Define the break-even point.
Determining the break-even point
The break-even point is the minimum volume of production and sales of products at which costs will be offset by income, and with the production and sale of each subsequent unit of product the enterprise begins to make a profit. The break-even point can be determined in units of production, in monetary terms, or taking into account the expected profit margin.
Effective management of the economic and financial results of an organization's production and economic activities is facilitated by the use of a methodology for analyzing the break-even point of production, which is based on the idea of dividing costs into fixed and variable.
The break-even point analysis methodology serves to answer the question: How many units of products or services must a business sell to recoup its fixed costs? It is assumed that prices should be high enough to compensate for all direct (variable) costs and leave the so-called "contribution margin" to cover fixed costs and profit.
Once enough units of output have been sold to offset fixed or recurring costs, each additional unit sold will generate additional profit over and above variable costs. Moreover, the amount of increase in this profit depends on the ratio of fixed and variable costs in the organization’s cost structure.
Once the volume of products sold reaches a minimum quantity sufficient to cover variable costs, the organization makes a profit, which begins to grow faster than the growth of production volume. The same effect occurs in the case of a reduction in production volumes, that is, the rate of decline in profits and increase in losses outpaces the rate of decrease in sales volumes.
The methodology for analyzing the break-even point allows you to develop and apply the concept of economic (“operational”) leverage in an organization.
Concept lever arises when the organization’s costs include stable elements, not directly dependent (within certain limits) on the volume of work performed. As a result profits rise or fall faster than changes in production volumes.
It is necessary to determine the impact on profit (J) of changes in sales volumes of finished products (V). The elements that determine the relationship between these variables are: unit price (P), variable cost per unit (C) and fixed cost (F).
Equality must be observed:
Vcr * P = F + Vcr * C.
Hence the profit is equal to:
J = VP – (VC + F) or J = V(P – C) – F.
The last formula shows that the amount of profit depends on the number of units sold, the difference between the price of a unit of production and the amount of variable costs attributable to it, i.e. the amount allocated to cover fixed costs and the amount of fixed costs.
Another way to determine the impact of operating leverage is to use the coefficient S, which characterizes the ratio of profit to the total volume of products sold:
Let's modify the formula:
This relationship shows that the profit/revenue ratio from product sales depends on the difference between revenue and variable (direct) costs (that is, the contribution margin) per unit of products sold, reduced by the amount of fixed costs as a percentage of sales revenue. This dependence confirms the fact that with an increase in the share of fixed costs, the profit/revenue ratio from product sales decreases. The greater the fixed costs, the greater the reduction in S. A change in volume, price, or unit cost will have a disproportionate effect on S because F is a constant.
- Describe the mathematical model for calculating the break-even point.
Break even
Break even
The break-even point is the minimum volume of production and sales of products at which costs will be offset by income, and with the production and sale of each subsequent unit of product the enterprise begins to make a profit. The break-even point can be determined in units of production, in monetary terms, or taking into account the expected profit margin. Synonyms: critical point, CVP point. Not to be confused with the payback point (of the project). It's not the same thing.
The break-even point in monetary terms is the minimum amount of income at which all costs are fully recouped (the profit is zero).
The break-even point in units of production is the minimum quantity of product at which the income from the sale of this product completely covers all the costs of its production.
The essence of marginal analysis is to analyze the ratio of sales volume (product output), cost and profit based on forecasting the level of these values under given restrictions. It is based on the division of costs into variable and fixed. In practice, the set of criteria for classifying an item as a variable or constant part depends on the specifics of the organization, the adopted accounting policy, the goals of the analysis and the professionalism of the relevant specialist.
The main category of marginal analysis is marginal income. Marginal income (profit) is the difference between sales revenue (excluding VAT and excise taxes) and variable costs. Sometimes marginal income is also called the coverage amount - this is the part of the revenue that remains to cover fixed costs and generate profit. The higher the level of marginal income, the faster fixed costs are recovered and the organization has the opportunity to make a profit.
Marginal income (M) is calculated using the formula:
where S is sales revenue; V - total variable costs.
The economic meaning of this indicator is the increase in profit from the release of each additional unit of production:
M = (S-V) / Q = p -v
where M is specific marginal income; Q - sales volume; p - unit price; v - variable costs per unit of production.
The found values of specific marginal income for each specific type of product are important for the manager. If this indicator is negative, this indicates that the revenue from the sale of the product does not even cover variable costs. Each subsequent produced unit of this type of product will increase the total loss of the organization. If the ability to significantly reduce variable costs is very limited, then the manager should consider removing this product from the range of products offered by the organization.
In practice, variable costs are more deeply detailed into groups of variable production, general production, general and other expenses. This entails the need to calculate several indicators of marginal income, from the analysis of which a decision is made about which groups of expenses can be most significantly affected by the impact on the final financial result.
Dividing costs into constant and variable, calculating marginal income makes it possible to determine the impact of production and sales volume on the amount of profit from the sale of products, work, services and the sales volume from which the enterprise makes a profit. This is done on the basis of an analysis of the break-even model (the “costs, production volume, profit” system).
The break-even model is based on a number of initial assumptions:
the behavior of costs and revenues can be described by a linear function of one variable - output volume;
variable costs and prices remain unchanged throughout the entire planning period;
the product structure does not change during the planned period;
the behavior of fixed and variable costs can be accurately measured;
At the end of the analyzed period, the enterprise has no inventories of finished products (or they are insignificant), i.e. sales volume corresponds to production volume.
The break-even point is the volume of output at which the enterprise's profit is zero, i.e. the volume at which revenue equals total costs. Sometimes it is also called the critical volume: below this volume, production becomes unprofitable.
Using the algebraic method, the zero profit point is calculated based on the following relationship:
I = S -V - F = (p * Q) - (v * Q) - F = 0
where I is the amount of profit; S - revenue; V - total variable costs, F - total fixed costs
From here we find the critical volume:
where Q " is the break-even point (critical volume in physical terms).
The critical volume of production and sales of products can be calculated not only in physical terms, but also in value terms:
S = F * p /(p - v) = Q" * p
where S is the critical volume of production and sales of products.
The economic meaning of this indicator is revenue at which profit is zero. If the actual revenue of the enterprise is greater than the critical value, it makes a profit, otherwise - a loss.
The above formulas for calculating the critical volume of production and sales in physical and value terms are valid only when only one type of product is produced or when the output structure is fixed, i.e. the proportions between different types of products remain unchanged. If several types of goods are produced with different marginal costs, then it is necessary to take into account the structure of production (sales) of these goods, as well as the share of fixed costs attributable to a specific type of product.
The closure point of an enterprise is the volume of output at which it becomes economically ineffective, i.e. at which revenue equals fixed costs:
where Q" is the closing point.
If the actual volume of production and sales of products is less than Q", the enterprise does not justify its existence and should be closed. If the actual volume of production and sales of products is greater than Q", it should continue its activities, even if it receives a loss.
Another analytical indicator intended for risk assessment is the “safety margin”, i.e. the difference between the actual and critical volumes of production and sales (in physical terms):
Kb = Of - Q "
where Kb is the safety edge; Of - the actual volume of production and sales of products.
K% = Kb / Qf * 100%,
where K% is the ratio of the safety edge to the actual volume.
The safety margin characterizes the risk of the enterprise: the smaller it is, the greater the risk that the actual volume of production and sales of products will not reach the critical level Q" and the enterprise will be in the loss zone.
Data on the value of marginal income and other derived indicators have become quite widespread for forecasting costs, sales prices of products, acceptable increases in the cost of production, assessing the effectiveness and feasibility of increasing production volume, in solving problems such as “make it yourself or buy it” and in other optimization calculations management decisions.
This is largely due to the comparative simplicity, clarity and accessibility of break-even point calculations. However, it must be borne in mind that the break-even model formulas are only suitable for those decisions that are made within an acceptable range of prices, costs and production and sales volumes. Outside this range, unit selling price and unit variable costs are no longer assumed to be constant, and any results obtained without such limitations may lead to incorrect conclusions. Along with its undoubted advantages, the break-even model has certain disadvantages, which are associated, first of all, with the assumptions underlying it.
When calculating the break-even point, they proceed from the principle of a linear increase in production and sales volumes without taking into account the possibility of a jump, for example, due to the seasonality of production and sales. When determining the conditions for achieving break-even and constructing the corresponding schedules, it is important to correctly set data on the degree of utilization of production capacity.
Analysis of the break-even point is one of the important ways to solve many management problems, since when combined with other methods of analysis, its accuracy is quite sufficient to justify management decisions in real life.
The break-even point determines what the sales volume must be in order for the company to break even and be able to cover all its expenses without making a profit. In turn, how profit grows with changes in revenue is shown by Operating Leverage (operating leverage).
To calculate the break-even point, you need to divide the costs into two components:
Variable costs - increase in proportion to the increase in production (volume of sales of goods).
Fixed costs do not depend on the number of products produced (goods sold) and whether the volume of operations increases or decreases.
The break-even point is of great importance in the matter of the viability of the company and its solvency. Thus, the degree to which sales volumes exceed the break-even point determines the margin of financial strength (margin of stability) of the enterprise.
Let us introduce the following notation:
B - sales revenue.
Рн - sales volume in physical terms.
Zper - variable costs.
Postage - fixed costs.
C - price per piece.
Zsper - average variable costs (per unit of production).
Tbd is the break-even point in monetary terms.
Tbn is the break-even point in physical terms.
Formula for calculating the break-even point in monetary terms:
Tbd = V*Zpost/(V - Zper)
The formula for calculating the break-even point in physical terms (in units of products or goods):
Tbn = Zpost / (C - ZSper)
In the figure below, the break-even point Tbn = 20 pieces
At the break-even point, the income line crosses and goes above the line of total (gross) costs, the profit line crosses 0 - moves from the loss zone to the profit zone.
Theoretical and methodological basis for determining the break-even point
For the successful development of the economy of any enterprise, it is necessary to study the relationship between the volume of production (sales) of products and costs and profits. This ratio is analyzed to study the complex of cause-and-effect relationships of the most important indicators of the final results of the enterprise, and the scientific substantiation of management decisions.
Tasks and stages of determining the break-even point of production
According to Vakhrushina, in the process of determining the break-even point, the following main tasks are solved:
The sales volume is calculated, which ensures full coverage of the enterprise’s costs;
The volume of sales is calculated, which ensures, other things being equal, the amount of profit required by the enterprise;
An estimate is given of the sales volume at which the enterprise can be competitive in the market, i.e., the calculation of the safety zone (field).
According to Sheremet A.D. The main steps in determining a safety point are:
1. Collection, preparation and processing of initial information in accordance with the conditions for analyzing the relationship between the volume of production (sales) of products and costs and profits;
2. Calculation of fixed and variable costs, break-even level and safety zone;
3. Justification of the volume of sales required to ensure the planned amount of profit.
Classification of costs into fixed and variable
Total costs, according to the degree of dependence on the volume of production, are divided into fixed and variable.
According to Sheremet A.D., fixed costs are costs whose value does not change with changes in the degree of utilization of production capacity, or changes in production volume (rent, communication services, administration salaries, etc.). Variables - costs, the value of which changes with changes in the degree of utilization of production capacity or production volume (these are direct material costs - raw materials, materials, fuel and electricity for technological purposes and labor costs - basic and additional payment for production current workers with contributions for social needs).
According to Ivashkevich, in current practice, the division of costs into fixed and variable is carried out by two main methods: analytical and statistical.
Analytical method. All costs of an enterprise are divided item by item into fixed and variable. This method is based on the use of variators (rate of cost growth / rate of growth (decrease) in production volume).
Statistical methods: minimum and maximum point method (mini-maxi method); graphical (statistical) and least squares method.
Mini-maxi method. Algorithm:
1) the max and min values of production volume and costs are selected;
2) there are differences in the levels of production and costs;
3) the rate of variable costs per 1 unit is determined (the difference in the level of costs for the period / the difference in production levels for the period);
4) the total value of variable costs for the maximum and minimum volume of production is determined (the rate of variable costs per 1 unit of production * the corresponding volume of production);
5) the total amount of fixed costs at the maximum and minimum points is determined (the total amount of costs is the sum of variable costs at the maximum and minimum points).
Graphical method - the total amount of costs is an equation of total (gross) costs.
Data on total costs for different volumes is plotted on the graph, then a line is drawn and the point of its intersection with the Y axis shows the level of fixed costs.
Example 3. Y = 5 + 10x with production volume (units): 2, 4, 6, 8, 10.
100 80 60 40 20 10x (variable costs)
5 fixed costs 2 4 6 8 10
Least square method. Differentiation using the least squares method gives the most accurate results.
The value of variable costs (rv) is determined:
Rv = (p?X Uval - ?X? Uval) / (p?X2 - (?X) 2),
where n is the number of periods;
X - production volume.
Total fixed expenses:
Rfix = (? Uval? X2 - ? X Uval? X) / (p? X2 - (? X) 2)
Then, we substitute these values into the total cost equation.
Determining the break-even point of production
According to Ivashkevich, dividing costs into fixed and variable, calculating amounts and coverage rates make it possible to determine the impact of production and sales volume on the amount of profit from the sale of products, work, services and the sales volume from which the enterprise makes a profit.
The break-even point (critical point, equilibrium point) is the volume of production (sales) that provides the organization with a zero financial result, i.e. the enterprise no longer incurs losses, but still has no profits.
According to Karpova, in the management accounting system, three methods are used to calculate the break-even point:
mathematical method (equation method);
marginal income method (gross profit);
graphic method.
Mathematical method (equation method)
To calculate the break-even point, first write down the formula for calculating the profit of the enterprise:
Unit price * X - Variable costs per unit * X - Fixed costs = 0,
where X is the volume of sales at the break-even point, pcs.
Then, on the left side of the equation, the sales volume (X) is taken out of brackets, and the right side - profit - is equated to zero (since the purpose of this calculation is to determine the point where the enterprise has no profit):
X * (Unit price - Variable costs per unit) = Fixed costs
Fixed costs
X = Price per unit - Variable costs per unit
Example. Fixed expenses of the enterprise are CU 28,000, and variable expenses are CU 19. for 1 piece Unit price CU 32 Determine the break-even point.
Solution: 28,000 / (32 - 19) = 2,154 pcs. - zero profit point
And also, knowing the critical volume, we can find the critical amount of revenue (2,154 * 32 = 68,928 CU)
Marginal income method (gross profit)
Marginal income is the amount of coverage, i.e. Marginal income must cover fixed costs so that the organization does not incur losses.
Marginal income = Revenue from sales of products - Variable costs;
Contribution Margin per Unit (Coverage Rate) = Price per Unit - Variable Cost per Unit
The coverage rate must cover the fixed costs per unit.
Revenue from sales of products (works, services) - Variable expenses - Fixed expenses = Profit
Marginal income = Fixed costs;
Marginal income per unit * X = Fixed costs;
Fixed costs Break-even point = Contribution margin per unit
Example. Fixed costs during the month amounted to CU 960,000, and variable costs CU 600. for 1 piece The price of the product is CU 1,200 per piece. Determine the zero profit point.
Solution: Contribution margin per unit = 1,200 - 600 = 600
960,000 / 600 = 1,600 - break-even point.
To make long-term decisions, it is useful to calculate the ratio of marginal income and sales revenue, i.e. determination of marginal income as a percentage of revenue. To do this, perform the following calculation:
Marginal income (RUB)
Sales revenue (RUB)
Graphical method
This method is based on the construction of two lines: the total cost line (Y = a + bx) and the revenue line (Y` = price * x). The intersection of these lines is the break-even point.
Line revenue costs profit revenue variable costs.
Break-even point loss fixed costs production volume.
Break-even point calculation
What is the selling price for the product?
The selling price of a product is the mechanism that brings money into a business. Logically, you should raise the price as high as possible to get the maximum margin (the difference between the selling price and the cost of your product). With sufficient margin from sales, you will be able to cover the costs of running the business. All that remains after paying off all expenses is your profit.
The second way is to reduce the unit cost of the product (the best idea for business) in order to get a higher margin by offering the average market price for the product.
Since your business is unknown to the bulk of potential buyers, the first thing you should pay attention to is whether you can offer buyers a lower price than your competitors. This is the most significant competitive advantage.
If your idea is other benefits for customers and the cost of your product is standard, then you need to look for a combination of advantages of your product or service that will be of particular value to customers, and they will be willing to pay a price above the market average for your product.
If you can't offer potential buyers a better price or greater value in purchasing your product, then you will have to spend a lot of time and money making your product attractive to potential buyers.
Margin is the basis of business income
The difference between the selling price and the cost of a product is the margin that allows you to weed out products that are unsuitable for business. What minimum margin can be considered acceptable for a new business? There is no direct answer to this question. There are only approximate numbers. If your product falls into the category of frequent consumption by customers, then the margin may not be very large, and the business will receive all its income from the number of sales. If sales are not very frequent, then the margin should be as large as possible. In any case, for a starting business the margin should be at least 40-45%.
Objectively speaking, this is a rather controversial assessment. Although, without a doubt, the business will be able to start and operate with a lower margin. But if your idea cannot provide such a margin at the start of the business, then it is unlikely that you will be able to create a successful business. In addition, the time to reach self-sufficiency will increase significantly and you will have to invest more money in the business and not for three or four months, but longer. Are you ready to run a business for 6 months without receiving any return from the business? Do your loved ones agree to wait for income for so long?
When you have decided on the selling price of your product or service, and your margin on the sale is more than 40-45%, then you need to calculate how many sales the business needs to make so that the business can recoup all its expenses, i.e. became self-sustaining.
Calculation of the business break-even point for one product (TBU)
Take the necessary data from the assessment plan table:
Fixed expenses – Amount b
Cost of a product or service – amount d
Fill out the table to calculate your business's profit for each volume (quantity) of sales. Use the following formulas:
Product cost = number of sales * per unit cost of product.
Total expenses = fixed expenses + total cost of products sold.
Sales revenue = selling price * number of sales
Profit = sales revenue – total expenses
If you do all the calculations in a spreadsheet, you can calculate the number of sales to achieve TBU for various conditions.
In our example, the business will become profitable after the 50th sale. Those. if you manage to sell 50 units of your product, then all subsequent sales are your net profit.
Experiment with different values for fixed expenses, production costs, and product sales price and see how these values affect the profitability of the business.
Evaluate the different options for allocating costs between fixed and variable costs from the previous assignment. See how this affects the number of sales required to reach the breakeven point.
To quickly calculate the number of sales, use the formula:
TBU (quantity) = SPR/(PC-SP)
For the example data we get 10000/(500-300) = 50 units of production. If the product is purchased one per person, then you need to do everything to create 50 potential buyers per month.
Calculation of TBU for several products
In the case of multiple products, you can calculate the required number of sales for each product if you first calculate the average selling price based on the sales margin of each product. If you have a small range of products or services, you can calculate the average selling price.
Knowing the cost of each of your products, calculate the cost of average sales:
(Selling Price Product_A) * 0.12 + (Selling Price Product_B) * 0.81 + (Selling Price Product_N) * 0.7 = average price per sale.
From the previous example, let us assume, for ease of calculation, that the markup (margin) is the same for all products at 45%. The average selling price (ASP) in this case will be the average cost (SP) * (1+ 0.45). Then
TBU (in monetary units) = TBU (quantity) * SPC.
For our example, 50 * 500 USD. = 25000 USD That is, you need to earn at least 25,000 USD per month so that you can recoup all costs.
If you have data on the average purchase (in cu) per customer for a similar business, then you can get the number of customers who are willing to purchase your products to provide the required income for your business.
Number of buyers = TBU (in monetary units) / average purchase size. Let's assume that the cost of an average purchase is 750 USD, then we need to serve 25,000/750=34 customers.
Plug your calculations into a spreadsheet and determine the break-even point for your product or products. Assess whether your business can attract enough customers in 3-4 months to then sell that or more units of the product each month. Reduce fixed costs. At first, refuse a prestigious office or expensive equipment. Reduce all fixed costs to a minimum. Try to reduce the cost of your product.
If you doubt the correctness of your theoretical calculations (and this should always be the case) because you do not have reliable information about the preferences of potential customers, then you need to test your assumptions about the price of the product in practice before opening a business. The test method is to develop and execute a startup marketing plan.
It is your responsibility to make sure in practice that your calculations are close to reality. If the results turn out to be bad, then abandon this business idea - it is not profitable.
It is necessary to calculate break-even points not only before starting a business, but also during its operation. It doesn't take much time and isn't difficult at all. It's much more difficult to achieve this in real life.
If the number of sales per month and the number of buyers required are quite realistic based on your work experience, then start planning a starting marketing plan to determine how to attract them, how to improve the product and how much money will be needed for this.
Enterprise break-even point
The break-even point is the main financial goal that a new business strives for at the beginning of its existence. The main goal is to break even. That is, to find the point where income is equal to or greater than expenses.
Variable expenses depend on the firm's business activities. If sales increase, then variable costs also increase. And vice versa. This, by the way, gives you the opportunity to regulate such costs. Variable costs are determined by how much resources and money are spent per unit of output. These include both production costs and logistics costs.
Fixed expenses are a weight on the feet of an enterprise. Payment for rent of premises, salaries to employees, monthly payments for financial obligations, etc. It is advisable to minimize fixed expenses in order to have better dynamism in the development of the business.
Your task is to calculate all the variable and fixed costs of your company. Only after this can you calculate the break-even point, the point above which profit will begin. What income is needed to cover all your expenses for a month, quarter, year? How much do you need to sell to get that kind of income from your products?
We determine how much margin (profit) we get from each unit of product sold.
For example, if you sold a unit of product for 10 rubles, and spent 5 rubles, then the margin will be 5 rubles.
If a month's fixed costs amount to 100 rubles, then you need to divide 100 rubles by 5 rubles (margin) - and you will get that to reach the break-even point you need to sell 20 units of products. This is a calculation in physical terms, in units of production.
In value terms, we multiply 20 units by the selling price of 10 rubles and get 200 rubles. This will be the break-even point of your business scheme. That is, after selling 21 units you will have a net profit!
The break-even point directly depends on what price you set for the product and how much you can sell over a certain period, that is, how much turnover you can make, and with what markup.
It is clear that at certain costs, increasing the price of your product will reduce the time to reach the break-even point and will provide more net profit. Therefore, work with price and marketing to increase sales comes to the fore.
Break-even point analysis
Business plan development tools
1. Brief information about the tool
Break-even analysis is a useful tool for examining the relationship between fixed costs, variable costs and profits. Break-even Point determines when an investment will generate a positive return. This can be shown graphically or simply mathematically. Break-even analysis calculates the physical volume of production at a given price required to cover all costs. Break-even price analysis calculates the price required for a given level of production to cover all costs. To explain how break-even analysis works, it is necessary to define costs.
Fixed costs incurred after the decision to begin business operations are not related to the level of production. Fixed costs include (but are not limited to) equipment depreciation, interest costs, taxes, and general overhead. Total fixed costs – The sum of fixed costs.
Variable costs are directly related to production volume. They may include cost of goods sold or production expenses, such as labor and electricity costs, food, fuel, veterinary services, irrigation and other expenses directly related to the production of commodities or investment in a capital asset. Total Variable Cost (TVC) is the sum of the variable costs for a given level of output or production.
Average variable cost is the variable cost per unit produced, or TVC, divided by the quantity produced.
Break-even Point analysis should not be confused with Payback Period, the time it takes to recoup an investment.
In the terminology of Value Based Management, the break-even point should be defined as the level of the operating profit margin ratio at which the business/investment receives the minimum acceptable level of profitability, i.e. total capital costs.
BEP can be calculated using the following formula:
BEP = TFC/(SUP - VCUP)
BEP - break-even point (product units);
TFC - total fixed costs / total fixed costs;
VCUP - variable costs per unit of production,
SUP - sales price to the production department.
2. Using the tool when developing a business plan
The main advantage of break-even analysis is that it explains the relationship between costs, output and profits. It can be expanded to show how changes in fixed-variable cost ratios, raw material prices, or revenues will affect revenue levels and break-even points. Break-even analysis is most useful in simulation modeling using partial budgeting or capital budgeting methods. The main advantage of using break-even analysis is that it shows the minimum level of economic activity required to avoid losses.
The main limitations of break-even point analysis:
Best suited for single product analysis;
It may be difficult to classify costs as both variable and fixed;
3. Approaches to developing a business plan
There are the following options for executing/preparing a business plan:
Independent development by the project initiator;
Transferring the project to third party specialists for development.
In this case, the following forms of execution/preparation of a business plan are possible:
Individual development by one specialist;
Individual (personalized) development, but with the participation of a TOP manager who will be responsible for the implementation of the project;
Collegial (with the help of a working group) development of a project with the participation of a TOP manager who will be responsible for the implementation of the project.
Depending on the:
Availability of the necessary specialists with the appropriate level of qualifications,
The economic and technological complexity of the project itself,
Investor's specific requirements,
Experience in the target market and with the selected volumes of activity, etc.
Works can be in 6 different combinations of forms and options. However, only 2 of them are acceptable (indicated in the figure by green areas), both from the point of view of cost justification and from the point of view of the quality of the project’s development and its suitability for justifying the effectiveness of the project to investors and for further use during implementation. At the same time, independent (by the enterprise itself) personalized development with the involvement of a top manager is acceptable when developing small and uncomplicated projects in familiar areas of activity. For large projects (with a large volume of investments, involving new technologies, external investors, with the prospect of entering new markets), the most practical option is to develop it by a group of third-party specialist consultants with the obligatory involvement of a top manager in the process, who will subsequently implement the project.
4. Statistics on the protection of business plans for investment projects and business plans for business development developed by Lex Group - 100%.
The most significant and successfully justified (protected) business plans (investment projects) in 2008-2009:
Business plan for the development of the activities of Tyumenstalmost LLC until 2013 (for obtaining commercial loans and government support);
Business plan for the construction of a multi-storey parking lot, a car service center and a car showroom in Tyumen (to attract a strategic investor);
Business plan for expanding the production capacity of the livestock complex of CJSC MTS Gagarinskaya (to obtain a preferential loan);
Business plan for the investment project “Development of a recreational area in the area of Lake Marukhi, Abatsky municipal district, Tyumen region” (to receive government funding);
Investment memorandum “Recreation center “Lesnaya Skazka” (to search for a strategic investor);
Business plan for the construction of the Vershina shopping and entertainment complex, Khanty-Mansi Autonomous Okrug (to attract investors and receive government support);
Financial and economic justification for the development strategy of the Shuryshkarsky district of the Yamal-Nenets Autonomous Okrug;
Project for the creation and development of the Khanty-Mansi Autonomous Okrug Agro-industrial holding (to attract investors and obtain government funding);
Business plan for organizing a Call Center in the Tyumen region (to attract a private investor);
Business plan for organizing the production of a unique organic fertilizer in the south of the Tyumen region on an industrial scale (to attract private investors);
Business plan for creating an enterprise for processing mercury-containing household and industrial waste in Tyumen (to attract private investors).
- Draw a graphical model for calculating the break-even point.
- IV. Determination of standard costs and calculation of financial support for the implementation of state (municipal) tasks
 (1 ratings, on average: 5,00 out of 5)